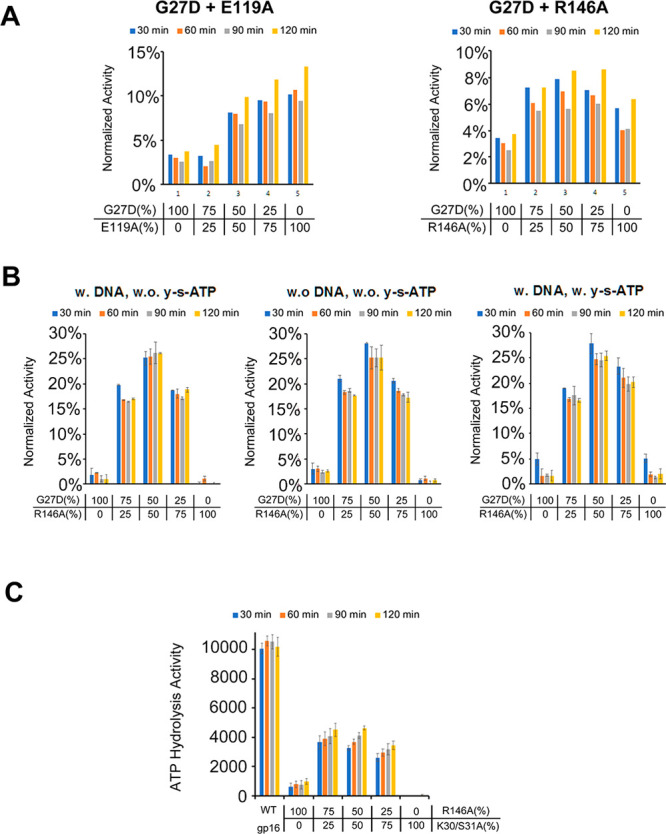
Figure 7.

Fluorometry to study the complementary effect of ATP hydrolysis ability among different gp16 mutants. The fluorescent signals were measured every 30 min after mixing, and the data were normalized to the activity of WT gp16 after 120 min. (A) Test of the complementary effect of gp16 mutants: Walker A mutant (G27D) complement with Walker B mutant (E119A), and Walker A mutant (G27D) complement with Arginine mutant R146A. (B) Complementary effect of G27D and R146A w/or w/o DNA and γ-S-ATP (n = 2). (C) Complementary effect of another Walker A mutant K30/S31A and R146A (n = 2).
