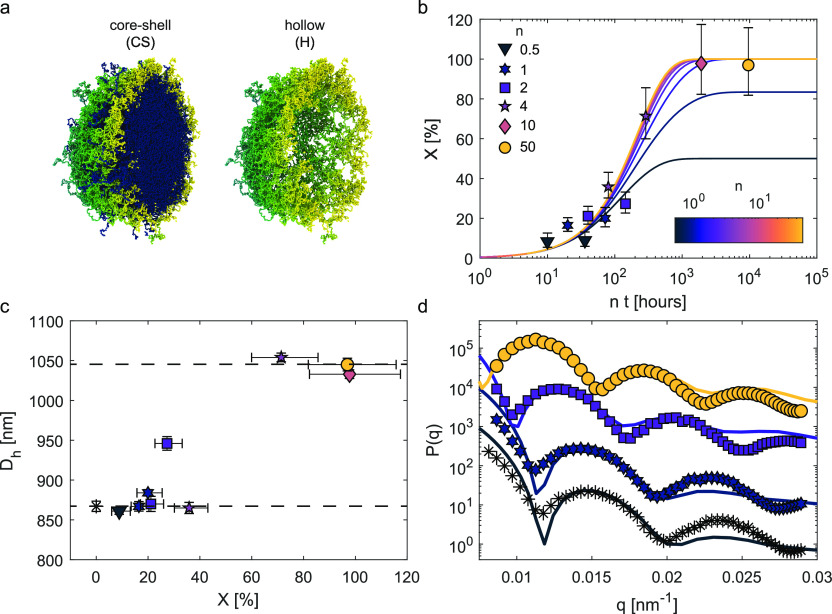
Figure 1.
Core–shell and hollow microgels in bulk aqueous suspensions: core degradation process. (a) Simulation snapshots of the cross section of a core–shell microgel before and after the removal of the inner core. The core with the DHEA cross-linker is colored in blue, and the outer shell with the BIS cross-linker is colored in green/yellow. (b) Extent of core removal X as a function of n·t, where n is the NaIO4 to DHEA molar ratio and t is the reaction time. The symbols indicate the values of X estimated from the experimental form factors (see Materials, Models, and Methods), whereas the lines show eq 2 fitted to the experimental X for different values of n. (c) Hydrodynamic diameter Dh of core–shell microgels as a function of the extent of core removal X. The horizontal dashed lines emphasize the sudden transition to a larger dimension upon removal of a critical core fraction. (d) Experimental (symbols) and numerical (lines) form factors as a function of the wavenumber q. The experimental form factors are for n·t = 0, 20, 144, and 9600, whereas the numerical ones are calculated for different number densities of the core microgel: ρ ≈ 0.08, 0.06, and 0.01 σ–3 (from the bottom to the top), where σ, representing the monomer size, is the unit length in the simulations. The yellow circles correspond to the hollow microgel (X = 100%). The form factors are arbitrarily shifted along the y-axis for visual clarity. The symbols in (c) and (d) correspond to the same values of n shown in (b), with * black symbols indicating the core–shell microgel prior to core removal (n = 0).

