FIGURE 1.

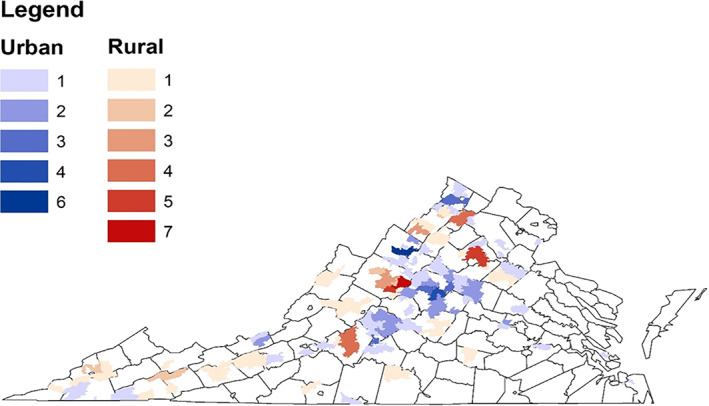
Map of frequency of patients per zip code. This figure displays the frequency of patients per zip code. Rural patients are denoted in red; urban patients are denoted in blue

Map of frequency of patients per zip code. This figure displays the frequency of patients per zip code. Rural patients are denoted in red; urban patients are denoted in blue