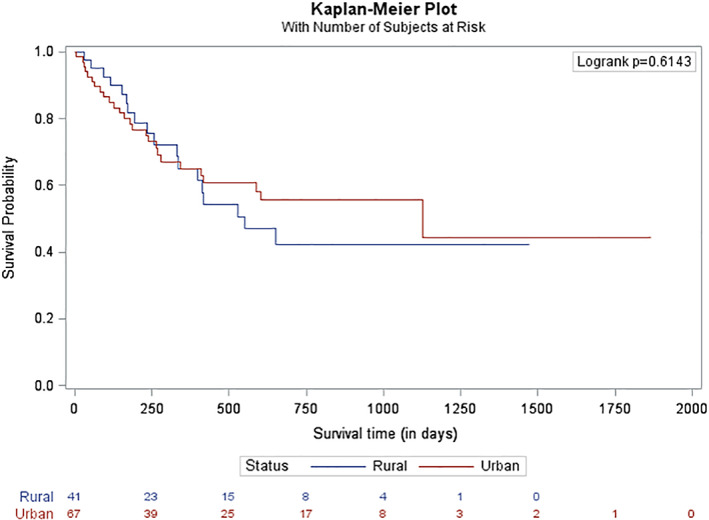
FIGURE 3.

Overall survival of patients undergoing induction chemotherapy. This figure demonstrates the overall survival for patients who underwent induction chemotherapy (defined as receiving an anthracycline and cytarabine; liposomal daunorubicin and cytarabine; mitoxantrone, etoposide and cytarabine; etoposide and cytarabine; or treated on a clinical trial of induction‐based chemotherapy) stratified by area of geographic residency
