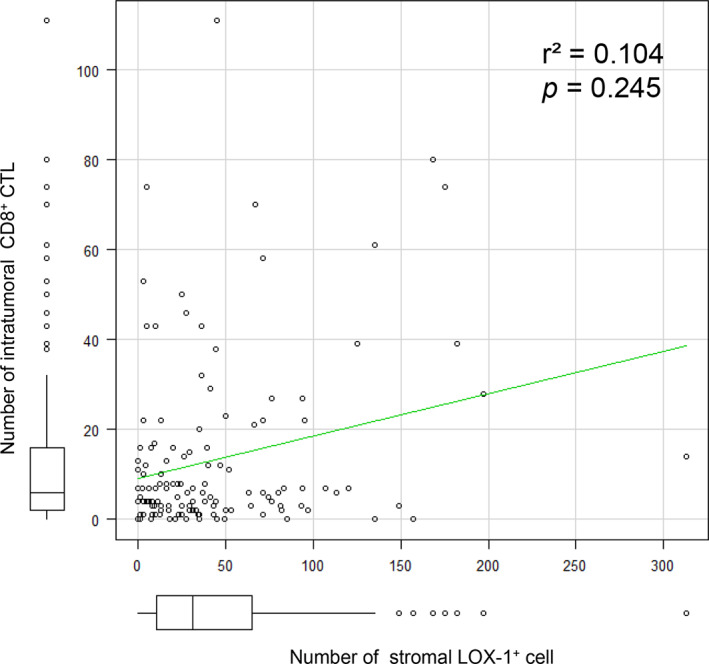
FIGURE 2.

Correlation between LOX‐1+ cells and CD8+ CTLs in the tumor tissue. The graph shows the number of LOX‐1+ vs intratumoral CD8+ cells in a 0.058 mm2 field area. No correlation was observed between them (r 2 = .104, P = .245). LOX‐1; lectin‐like oxidized low‐density lipoprotein receptor‐1. CD8+ CTL; CD8+ cytotoxic T‐lymphocytes
