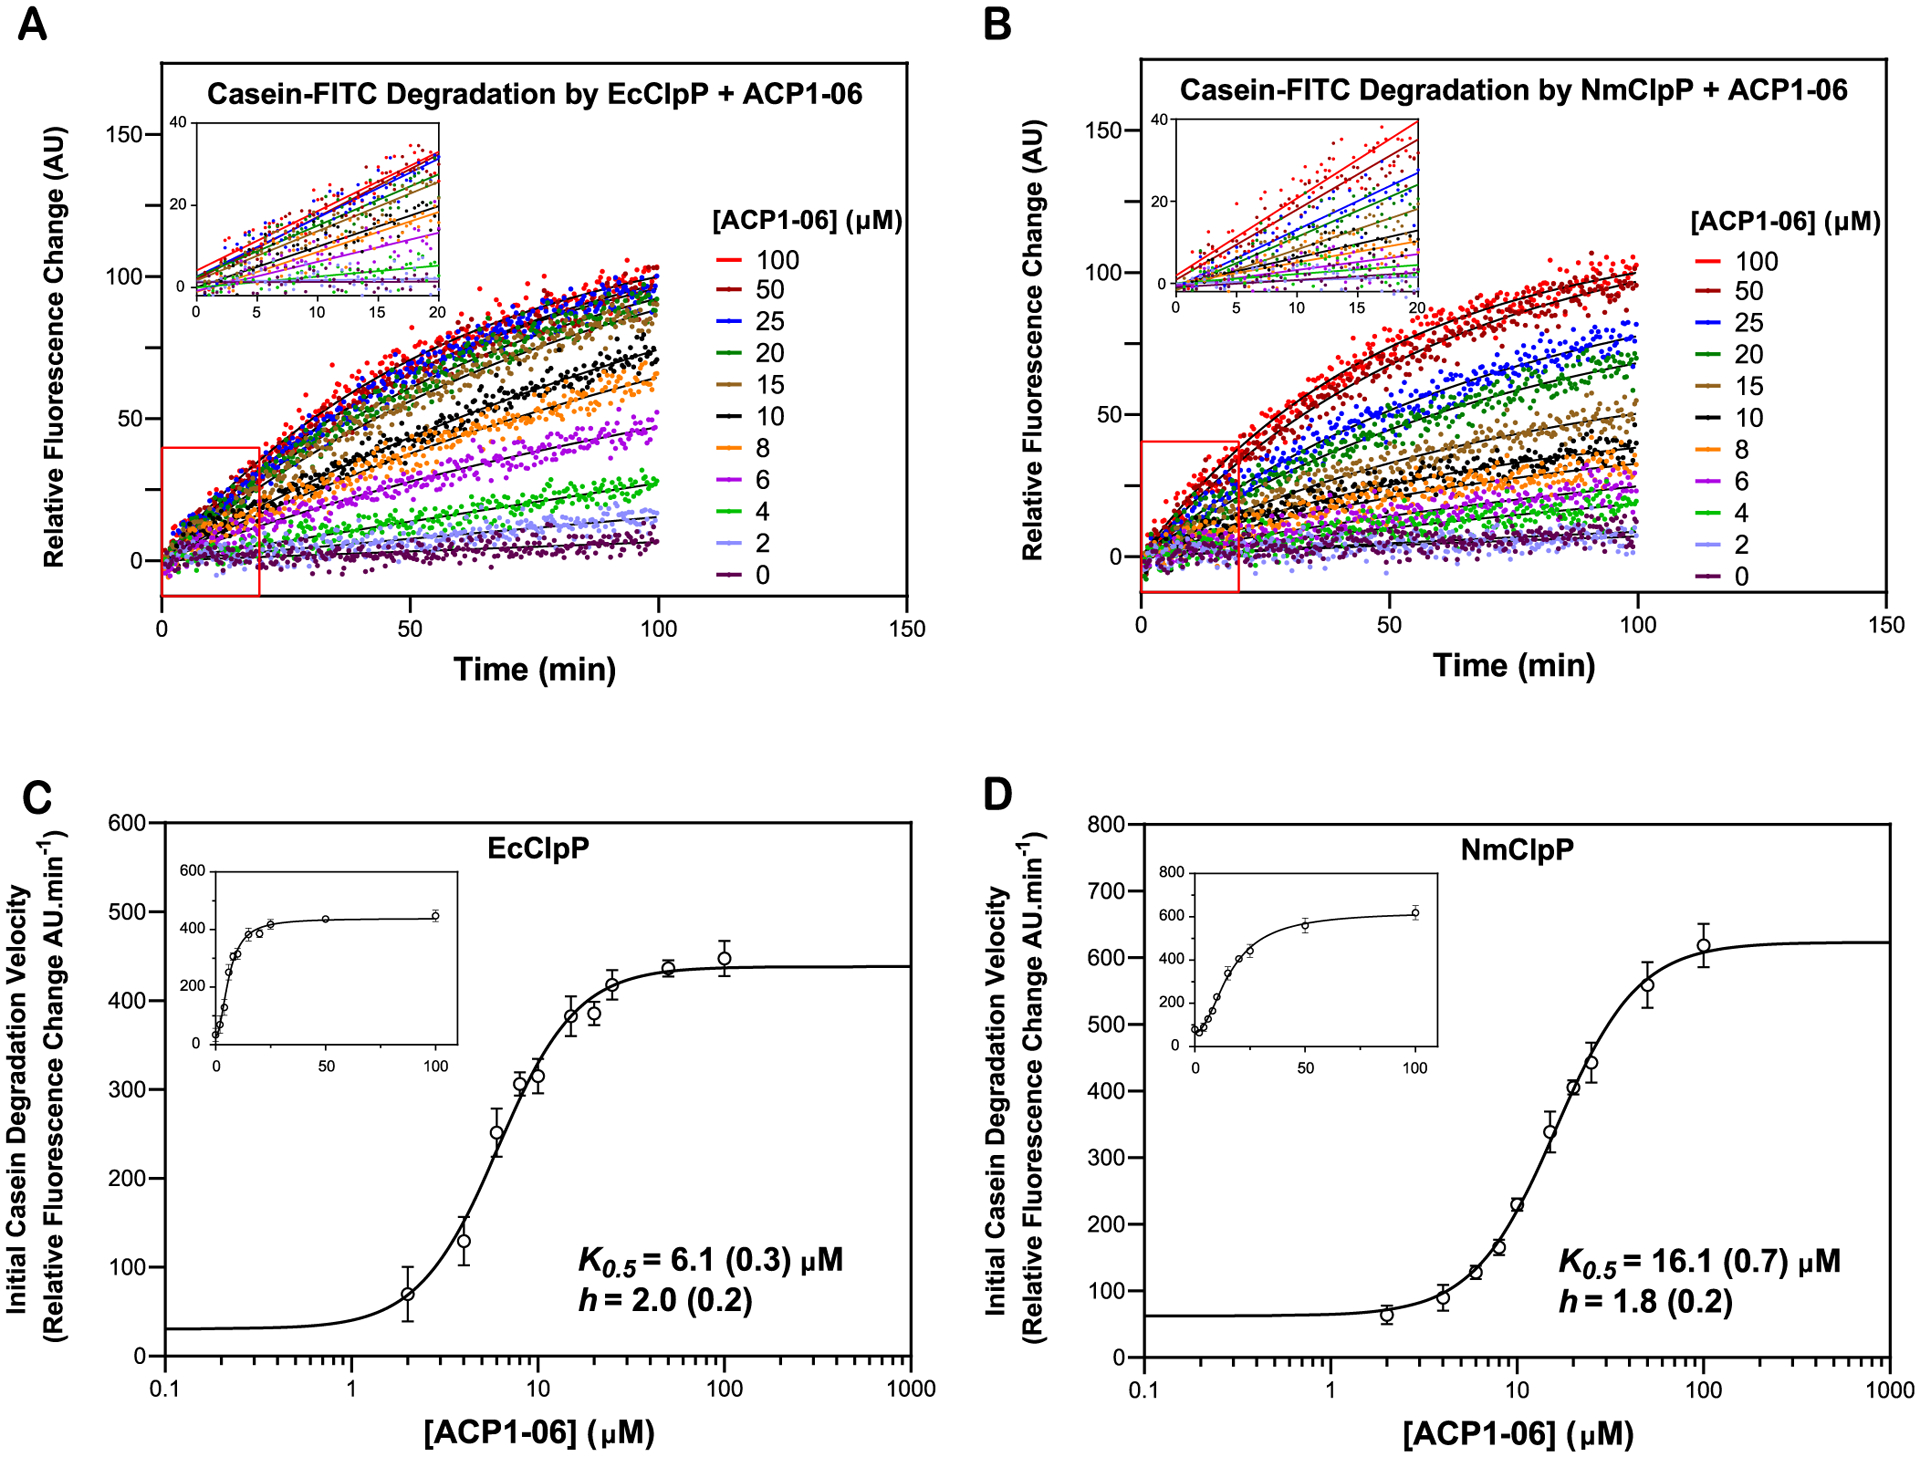
Figure 5.

Measurement of the binding of ACP1-06 to EcClpP and NmClpP. (A,B) Shown are representative curves of casein-FITC degradation by EcClpP or NmClpP in the presence of different concentrations of ACP1-06. Data were normalized to the 100 μM ACP1-06 reaction. Experiments were repeated three times. Solid black lines show fits to single exponentials. Insets show the linear fits from 0.66 to 20 min. (C,D) K0.5 (equivalent to EC50) and h (Hill coefficient) for ACP1-06 binding to EcClpP and NmClpP were determined by fitting the change in initial degradation velocity of casein-FITC by compound-activated ClpP as a function of compound concentration to a Hill equation (see Methods). The data and fits are shown as semilog plots in the main figures and as regular plots in the insets. The data points in the absence of ACP1-06 are not shown on the semilog plots. Error bars represent the standard deviations from the average of three repeats.
