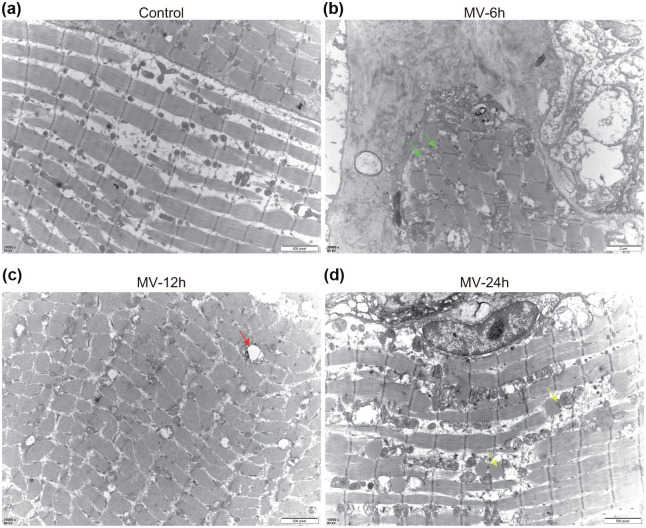
Figure 6.
Morphologic abnormalities of mitochondria and autophagy in the diaphragm. (a) Representative TEM results in the control group showed normal ultrastructure and the absence of autophagosomes; (b) Representative TEM images from the MV-6h group, showing mitochondria are swollen and fragmented, with disorganized cristae (green arrows); (c) Representative TEM images from the eMV-12h group, showing autophagosomes and swollen mitochondria (green arrows); and (d) Representative TEM images from the MV-24h group, showing lipid droplets (yellow arrows).
M, mitochondria; N, nucleus.

