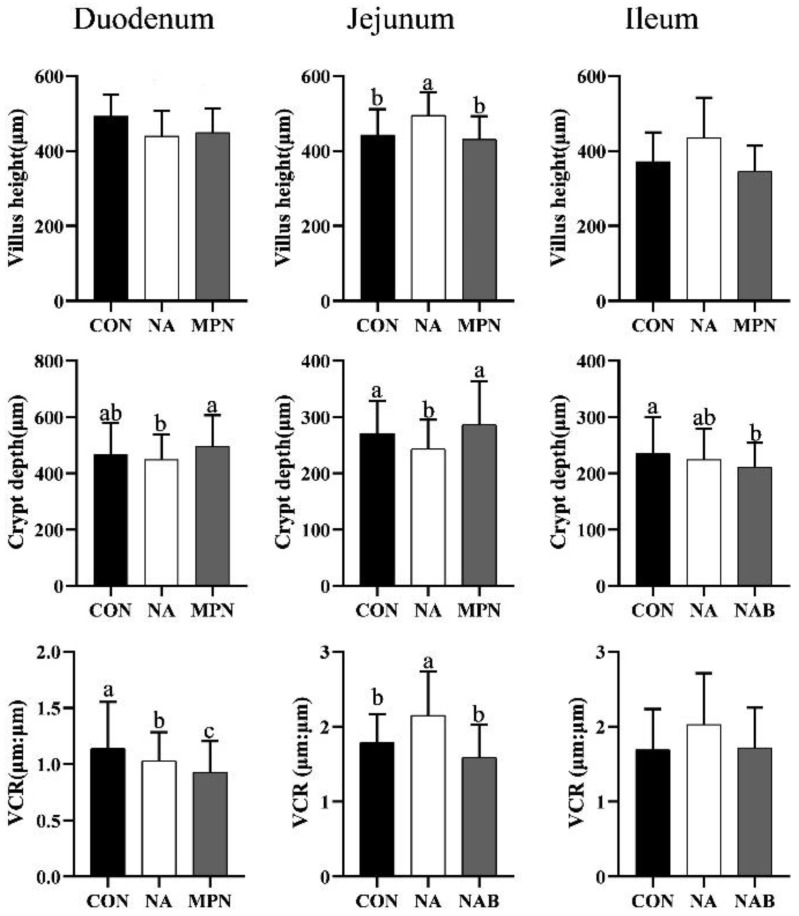
Figure 1.
Effect of niacin on intestinal morphology in weaned piglets. Values are expressed as the mean ± SD, n = 8/treatment. a, b, c Values with different superscripts in the same row differ significantly (p < 0.05). VCR, villus height-to-crypt depth ratio; CON, control group; NA, niacin group; MPN, GPR109A antagonist group.

