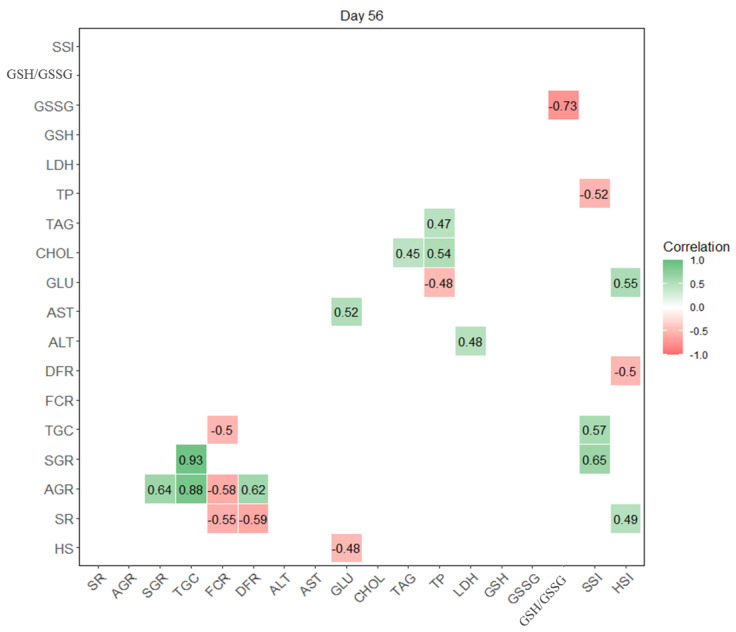
Figure 1.
Correlation matrix between HS diets (0, 1, 3, 6%), growth (AGR, SGR, TGC), production (SR, FCR, DFR), biochemical (ALT, AST, GLU, CHOL, TAG, TP, LDH) and antioxidant (GSH, GSSG, GSH/GSSG) parameters and somatic indices (SSI, HSI) after 56 days of feeding. Negative correlations are coloured in red, and positive are in green, with a scale from –1 to +1 with 0 representing the absence of correlation (no colour in figure). Correlations are assessed as strong (positive > 0.7, negative ˂ −0.7), moderate (±0.5 to ±0.7), weak (±0.3 to ±0.5), and very weak (0 to ±0.3).

