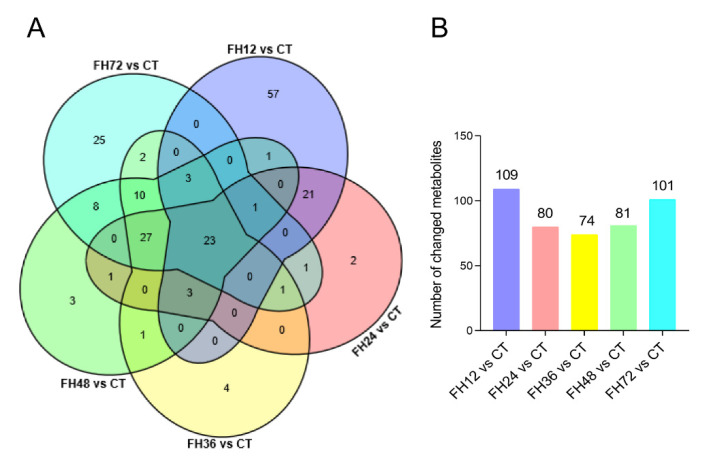
Figure 4.
(A) Venn diagram of the changed metabolites for different treatments and (B) the changed metabolite numbers during different fasting durations when compared with the non-fasting group. CT—birds fed ad libitum; FH12—birds fasted for 12 h; FH24—birds fasted for 24 h; FH36—birds fasted for 36 h; FH48—birds fasted for 48 h.

