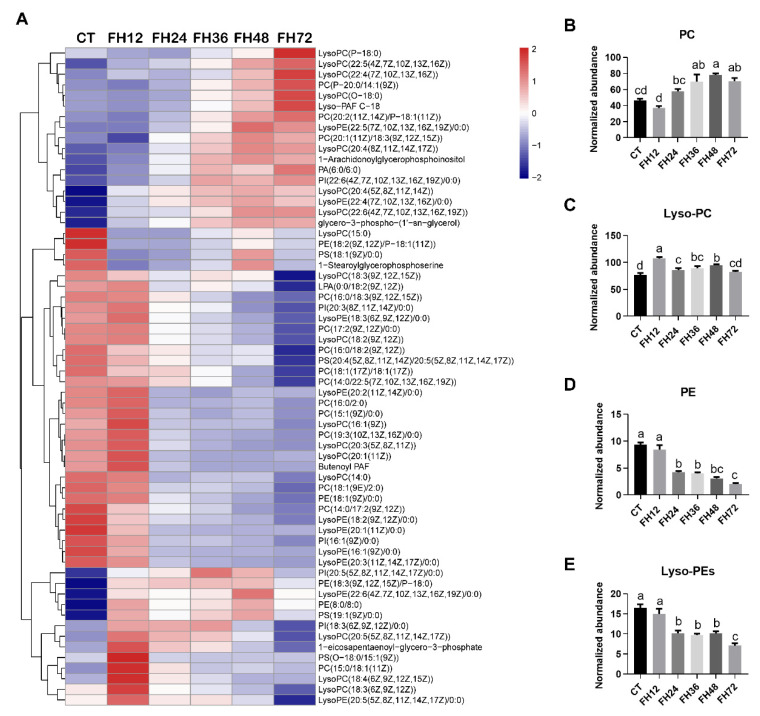
Figure 7.
Effect of fasting duration on the serum glycerophospholipid metabolome. (A) Heatmap of glycerophospholipids during the different fasting duration. Changes in PC (B), Lyso-PC (C), PE (D), and Lyso-PE (E) in response to fasting. Data are analyzed by ANOVA and multiple comparisons using the Duncan correction. Values are means ± SEM, n = 8. Labeled means without a common letter are significantly different, p ≤ 0.05. CT—birds fed ad libitum; FH12—birds fasted for 12 h; FH24—birds fasted for 24 h; FH36—birds fasted for 36 h; FH48—birds fasted for 48 h.

