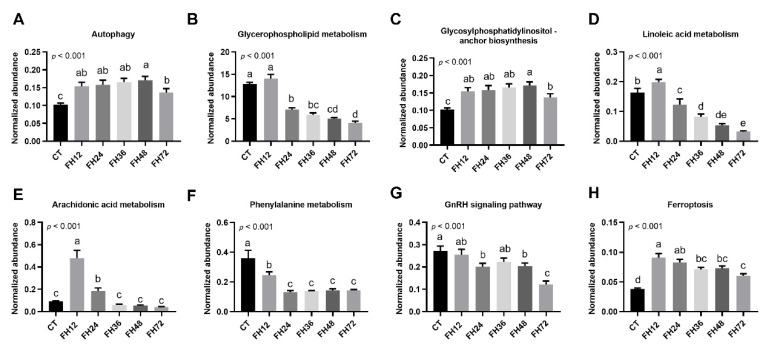
Figure 9.
Effects of food withdrawal on the serum metabolome. (A–H) The normalized abundance of metabolite pathways from the control and fasting groups. Data are analyzed by ANOVA and multiple comparisons using the Duncan correction. Values are means ± SEM, n = 8. Labeled means without a common letter are significantly different, p ≤ 0.05. CT—birds fed ad libitum; FH12—birds fasted for 12 h; FH24—birds fasted for 24 h; FH36—birds fasted for 36 h; FH48—birds fasted for 48 h.

