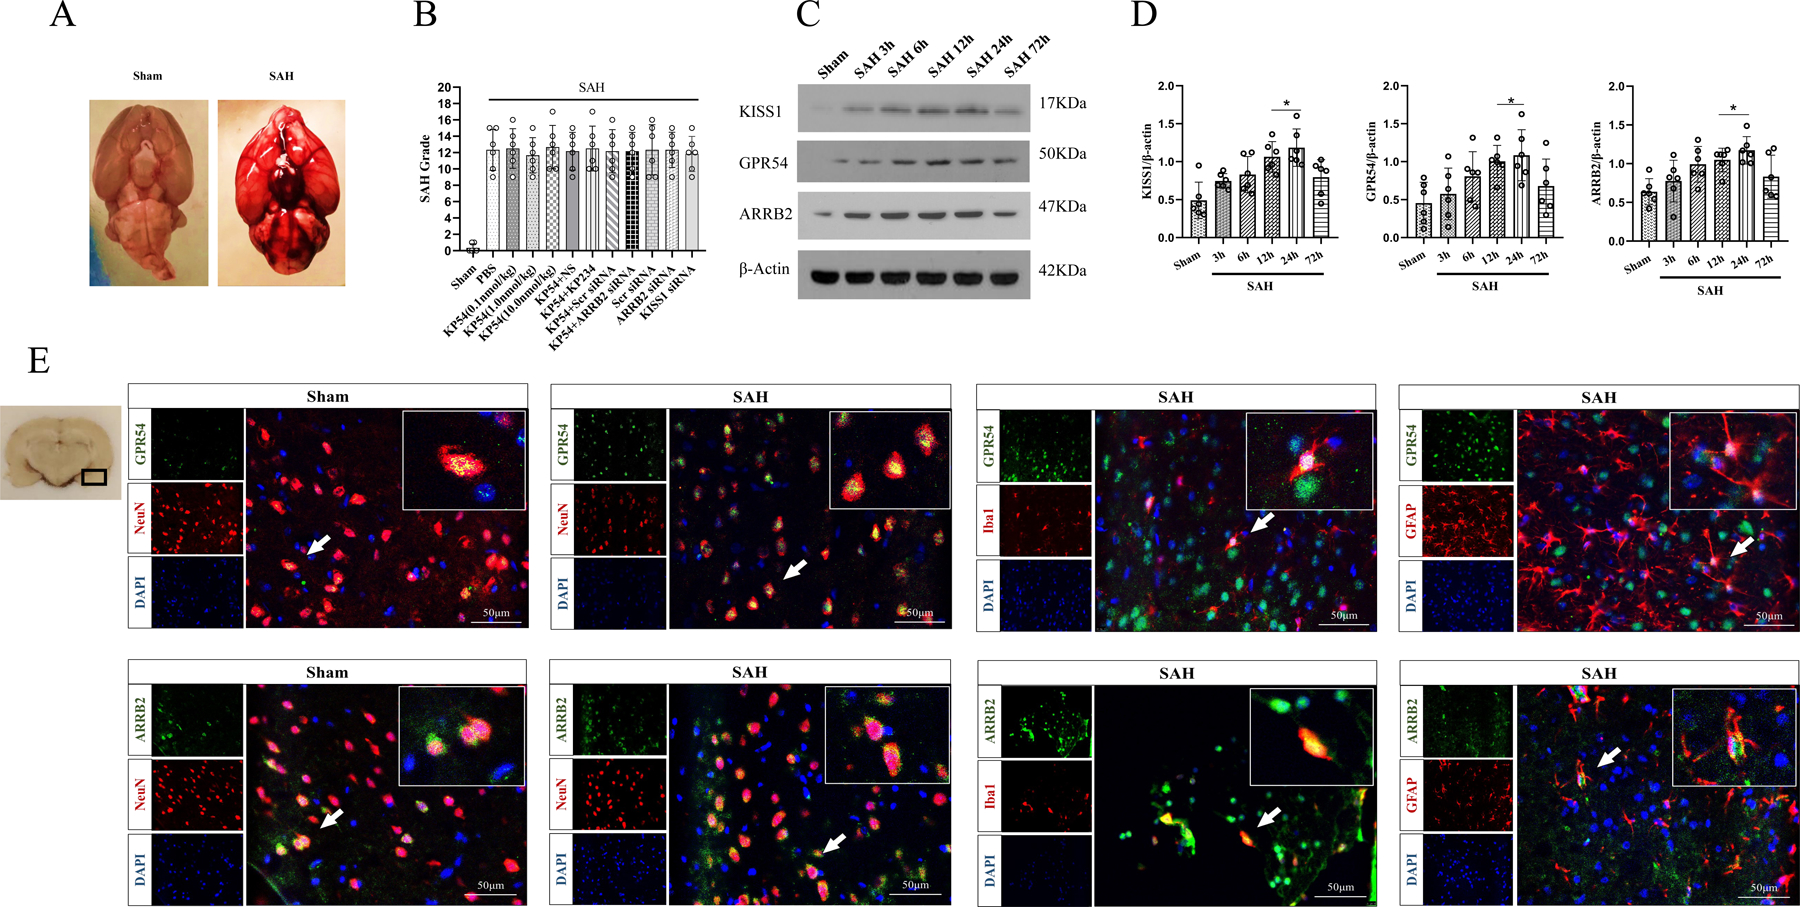
Fig. 2. The temporal expressions of KISS1, GPR54 and ARRB2 within ipsilateral brain hemisphere after subarachnoid hemorrhage (SAH).

(A) Representative pictures showed that subarachnoid blood clots mainly presented around the circle of Willis in the rat brain at 24 h after SAH; (B) SAH grading scores of all SAH groups. (C) Representative western blot bands of KISS1, GPR54 and ARRB2; (D) Time course and densitometric quantification of KISS1, GPR54 and ARRB2. *p < 0.05 vs. Sham group. Data was represented as mean ± SD, n = 6 per group, one-way ANOVA Tukey test was used for the comparison between sham and SAH groups. (E) Immunofluorescence staining of GPR54 or ARRB2 with neurons (NeuN, red), microglia (Iba-1, red) and astrocytes (GFAP, red) at 24 h after SAH. The small black box in the coronal brain slice (left of top panel) indicated the area where microphotograph was taken. Scale bar = 50μm, n = 2 for each group.
