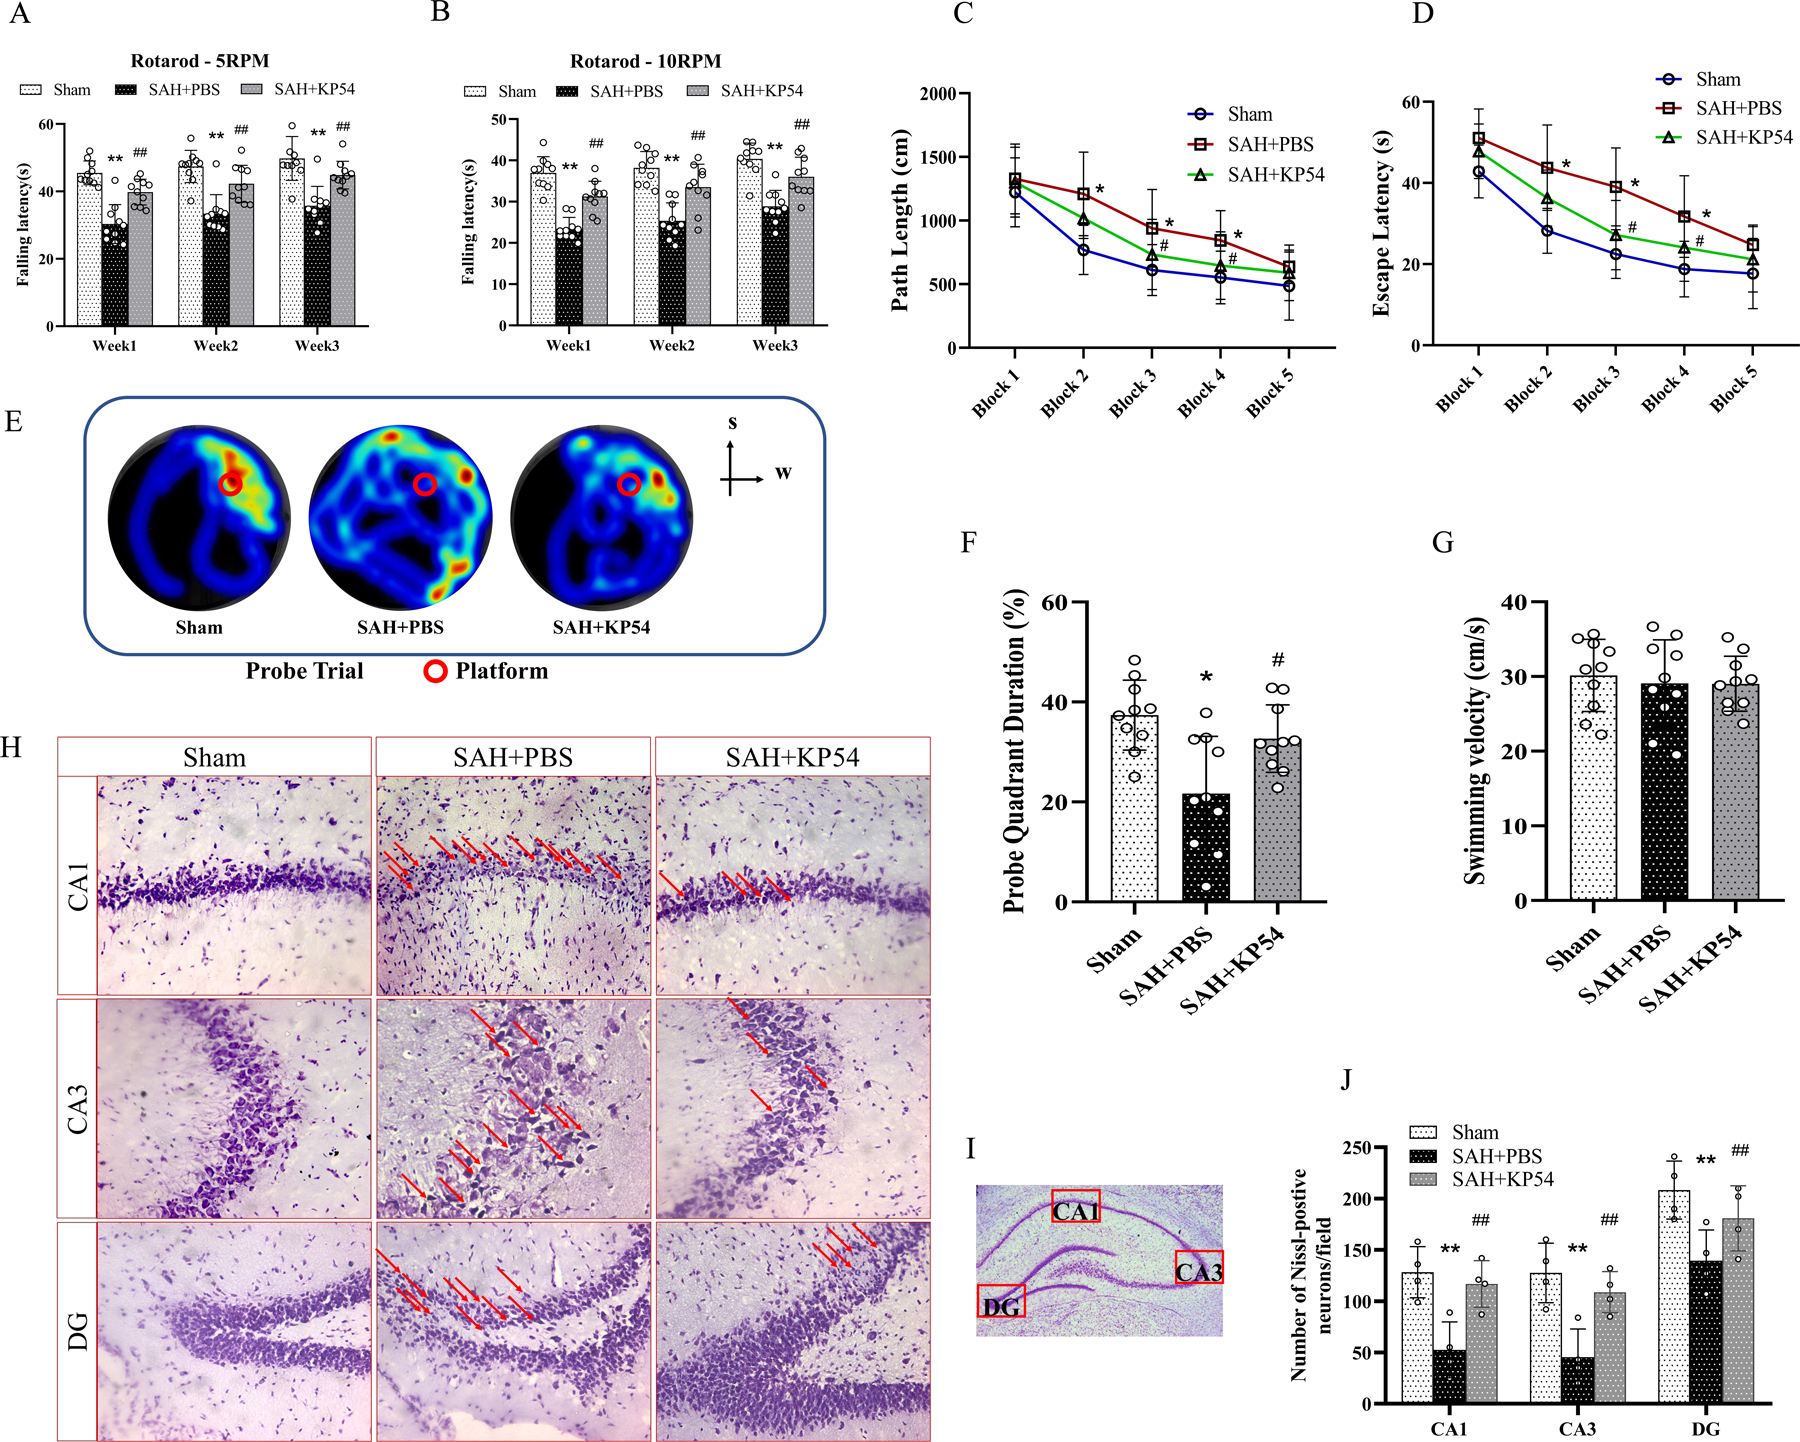
Fig. 6. KP54 treatment improved the long-term outcomes at 28d after SAH.

(A, B) Rotarod tests of 5rpm and 10rpm at every week; (C, D) Escape latency and swim distance of water maze test at 28d,; (E) Representative heat map of probe test showed that KP54 treated SAH rats spent more time in target quadrant; (F) Quantification of the probe quadrant duration in the probe trial,; (G) Swimming velocities of different groups in probe trial; (H) Representative microphotographs of Nissl staining within the hippocampal CA1, CA3 and DG regions showed the damaged neurons (red arrows); (I) Representative microphotograph of Nissl staining showed the location of CA1, CA3 and DG regions within the left hippocampus; (J) Quantifications of the surviving neuron within in hippocampal CA1, CA3 and DG regions, *P < 0.05, **P < 0.01 vs. Sham group; #P < 0.05, ##P < 0.01 vs. SAH + PBS group. Data represent with mean ± SD, n = 4 or 10 per group. Two-way ANOVA-Tukey for repeated measures of Rotarod and water mazes. One-way ANOVA-Turkey for measurements in probe trial and Nissl staining.
