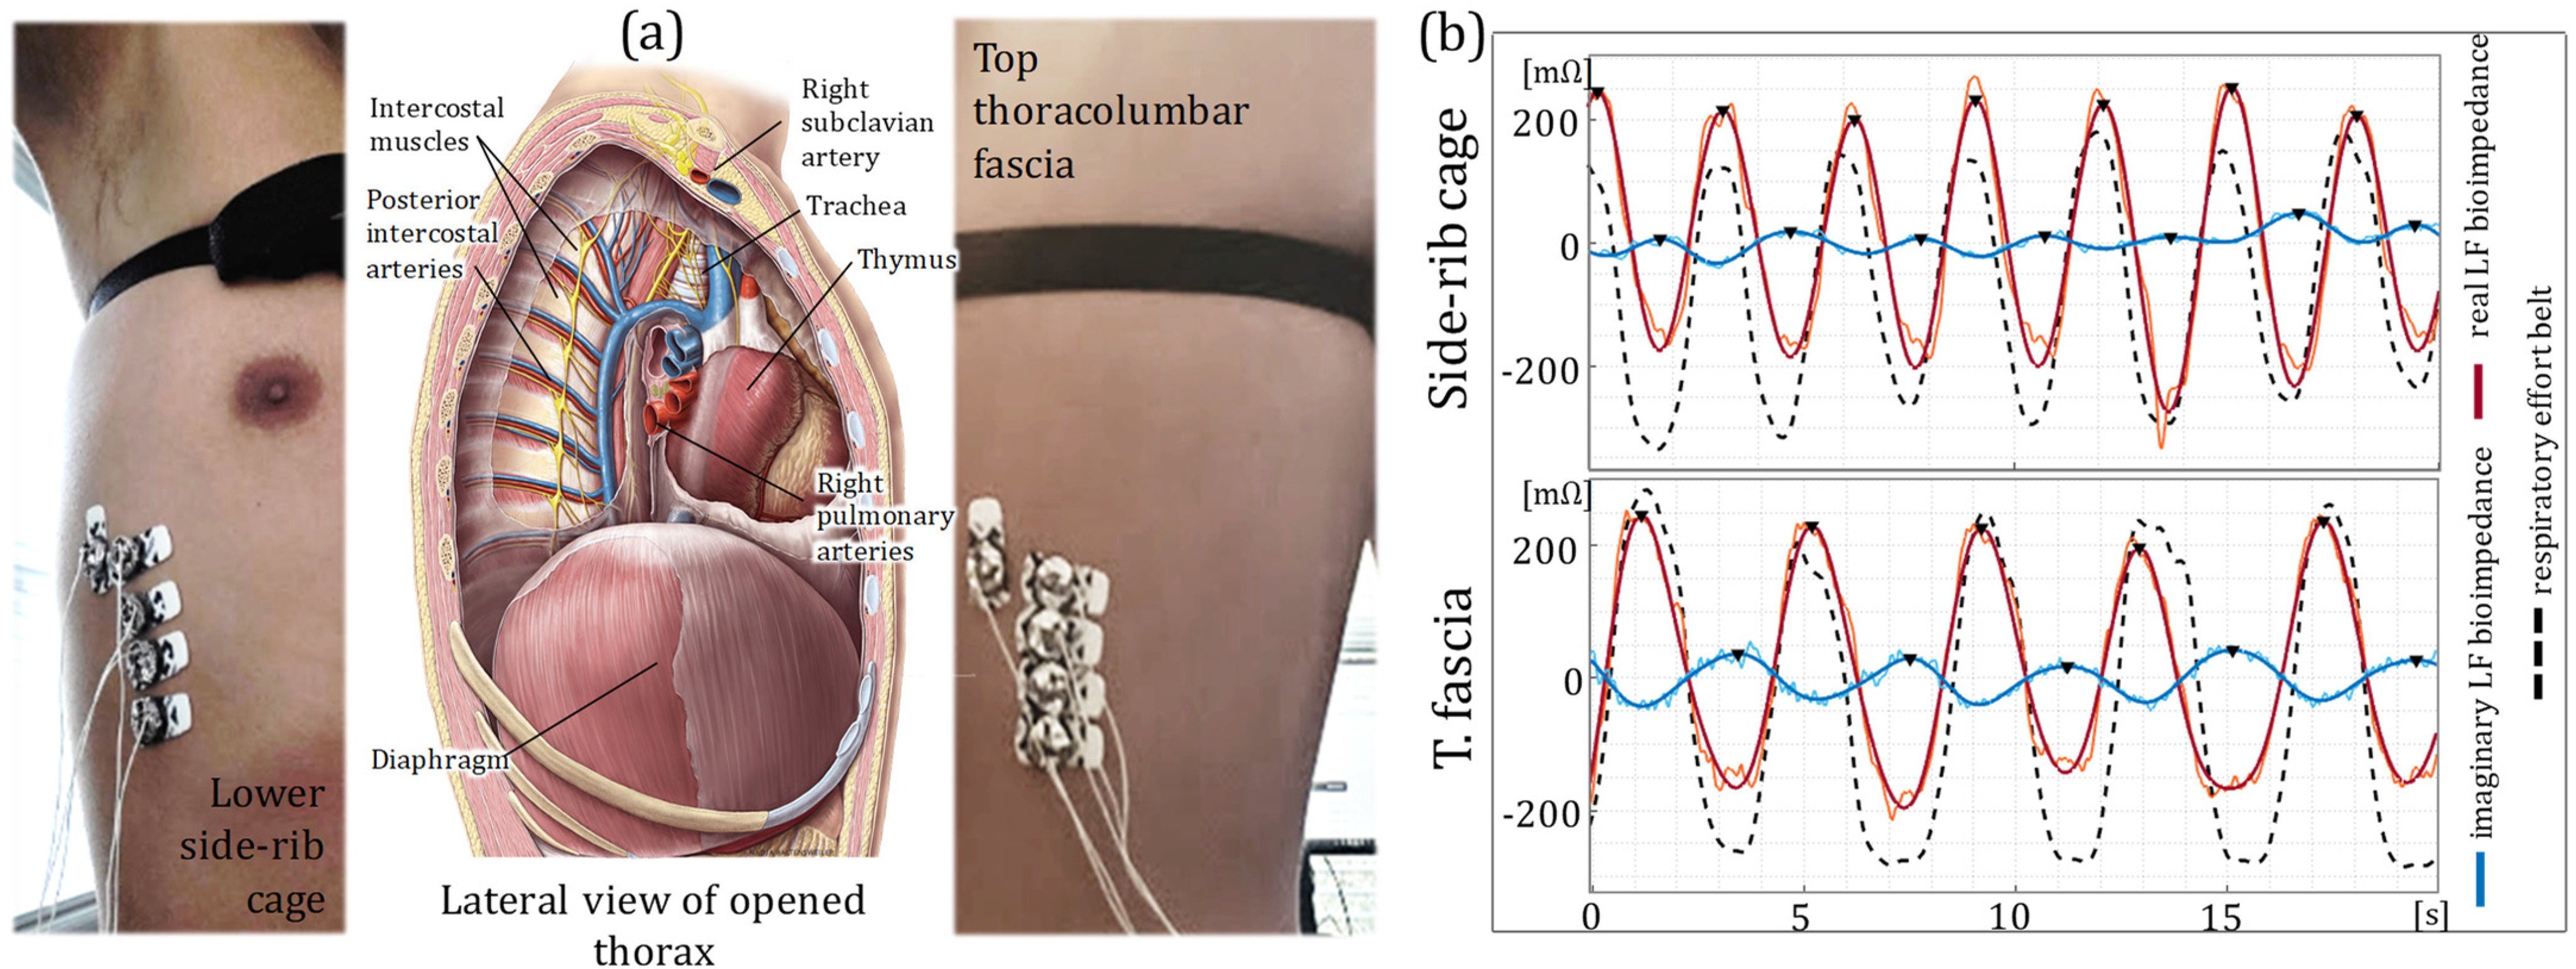
Figure 3.

Thoracic bioimpedance measurements. (a) The anatomical description of the thorax and the thoracic cavity, showing the diaphragm, trachea, muscles and arteries. Electrode placement is shown for both lower side-rib cage (left) and top thoracolumbar fascia (right). (b) Time plot of the LF real (red) and imaginary (blue) bioimpedance signals and the reference respiratory effort belt (dashed black) for the side-rib cage (top) and top thoracolumbar fascia (bottom) locations. The bioimpedance signals show a strong agreement with the respiratory effort belt indicating a strong respiration influence over the thoracic bioimpedance measurements.
