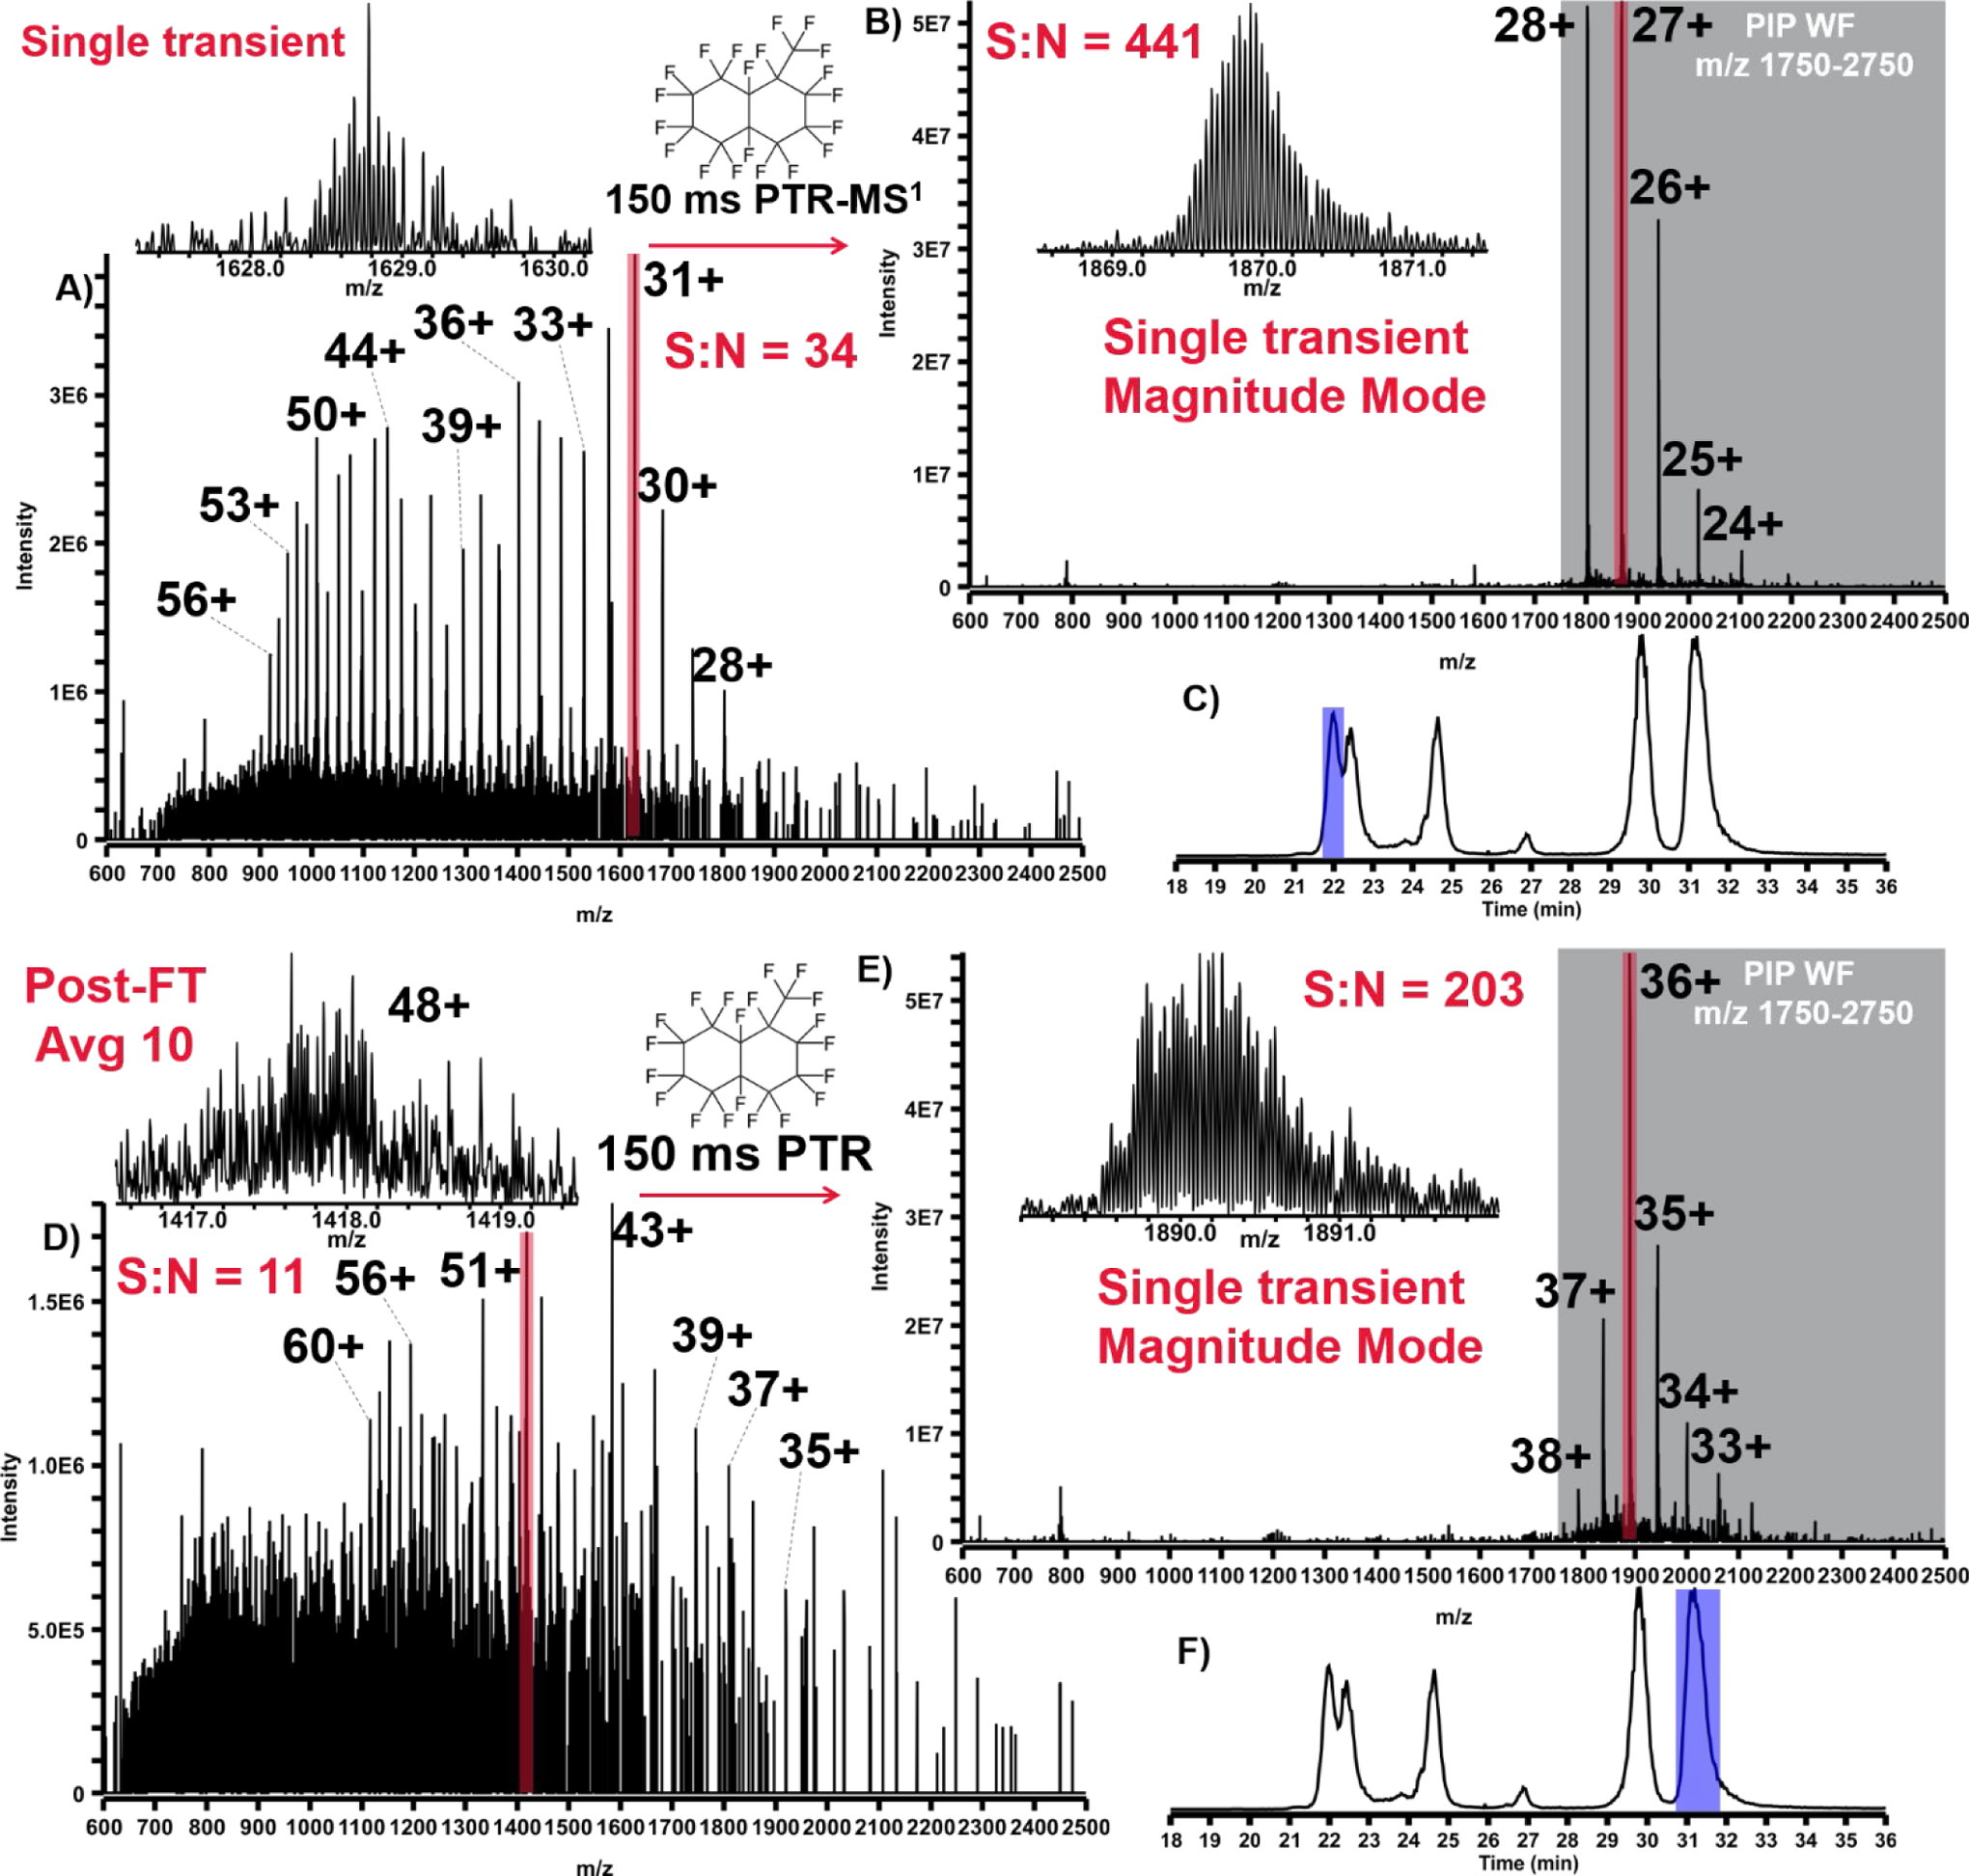
FIGURE 2.

LC-MS analysis of intact protein standard mixture with spectra taken from the apex of elution profiles for both protein AG (50 kDa) and exo-Klenow fragment (68 kDa). A) Spectrum of protein AG under normal MS1 conditions with the most abundant charge state highlighted in red. B) Spectrum of protein AG under PTR-MS1-PIP conditions with the most abundant charge state highlighted in red and the range of m/z intended for PIP shaded in grey. C) LC-MS total-ion chromatogram for the analysis with the region over which protein AG elutes highlighted in blue. Figures 2D, E, & F the same respectively for the exo-Klenow fragment.
