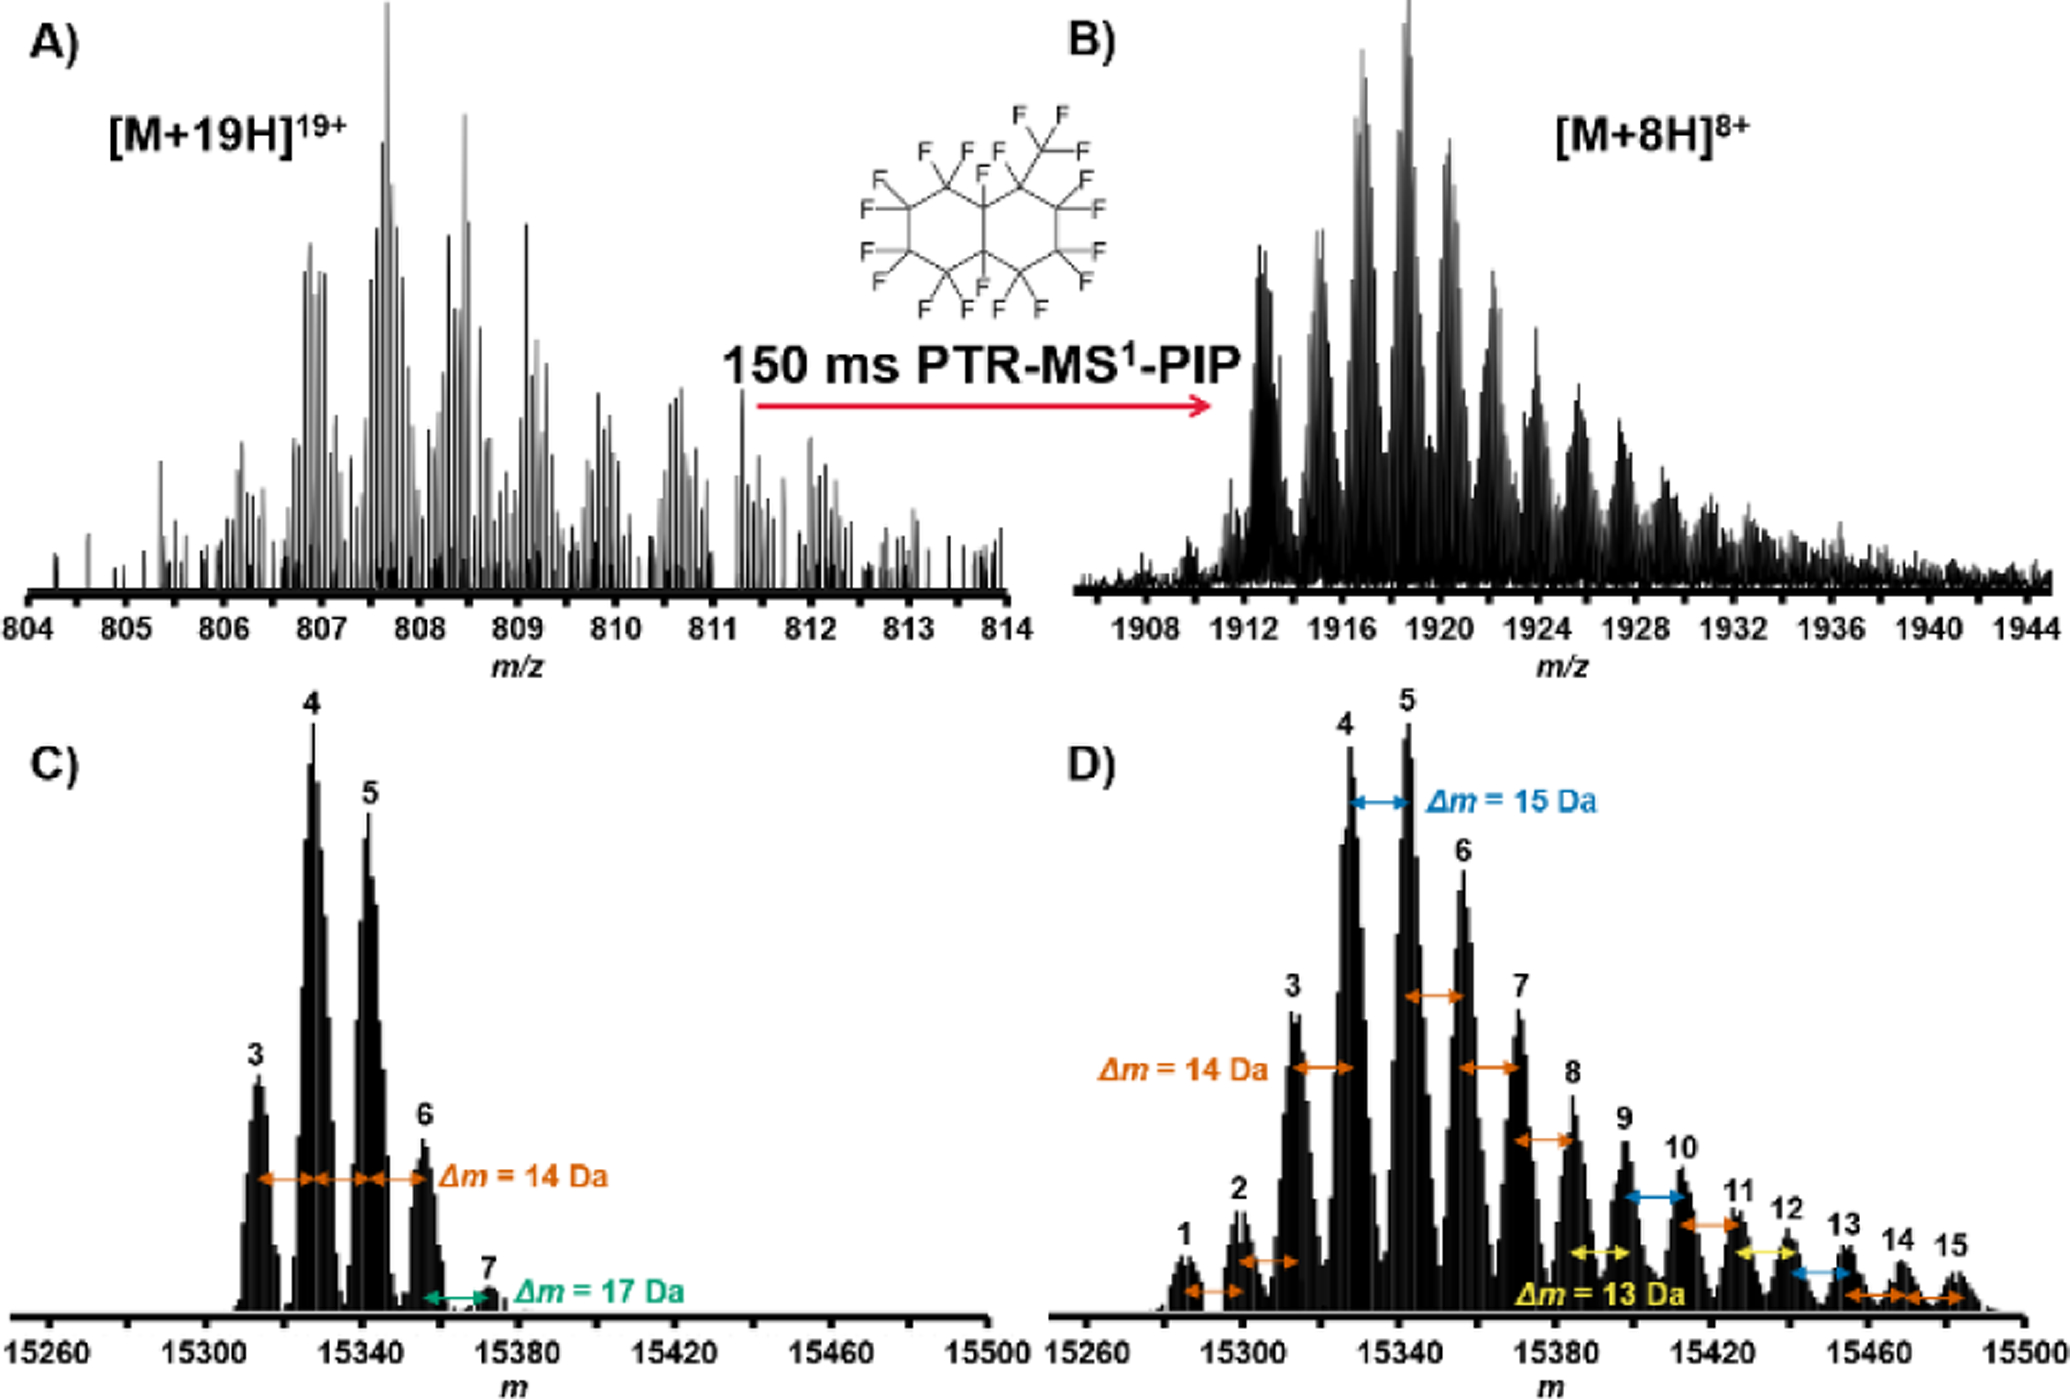
FIGURE 3.

LC-MS analysis of whole cell lysate proteins from H. Sapiens MCF7 cells. A) Region of mass spectrum taken with normal MS1 conditions containing isotopic peak clusters for a protein exhibiting a “family” of associated proteoforms. B) The same region measured under PTR-MS1-PIP conditions shows a more defined set of associated proteoforms from improved S:N. C) Deconvolution of the peak clusters shown in the normal MS1 spectrum yielded 5 proteoforms. D) Deconvolution of the respective peak clusters of the PTR-MS1-PIP spectrum yielded 15 proteoforms. Xtract-determined monoisotopic mass differences (Δm, Da) among proteoforms are indicated.
