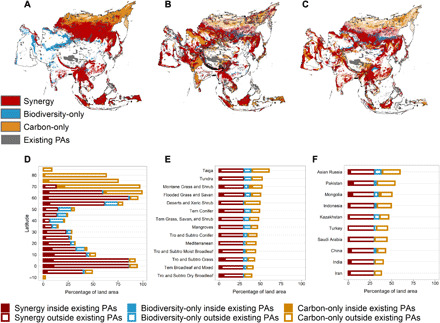
Fig. 1. The priorities of biodiversity-only, carbon-only, and synergy of both at three scales.

Areas in gray are existing protected areas falling outside the priorities at (A) Asian regional, (B) biome, and (C) national scales, respectively. The synergistic-target priorities are based on the 50% richness as a mask to extract the highest combined values of richness and carbon clipped to 30% land area. Bar charts show the percentages of biodiversity orientation (blue), carbon orientation (orange), and synergy (red) in (D) latitudinal, (E) biome, and (F) national areas, respectively. Hollow bars show priorities outside the current network of protected areas for biodiversity-only (blue), carbon-only (orange), and synergy (red), which could be suitable expansion for new protected areas and focused on each conservation action. See table S1 for the corresponding biome names and their abbreviations. Only the top 10 countries containing the priority area of three metrics are shown in the bar charts at the national scale.
