Figure 2.
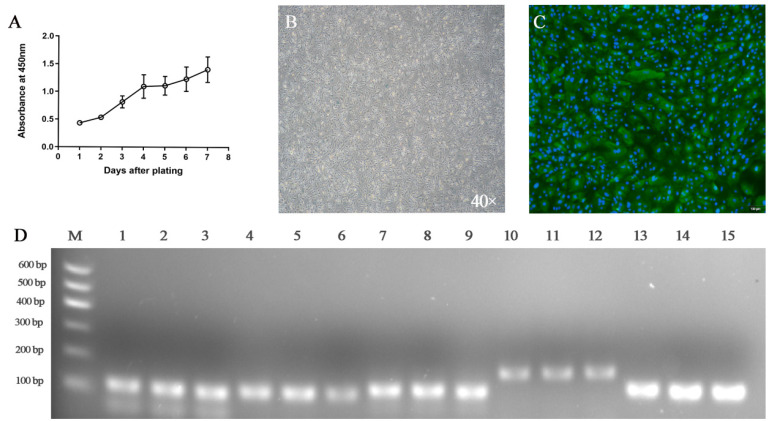
Characteristics of goat rumen epithelial cells. (A) Growth curve of GRECs in culture. Data shown are means ± SEM (n = 3). (B) Analysis of GRECs senescence (100×). The appearance of blue is due to the expression of β-galactosidase, which indicates that senescence occurs in GRECs. (C) Immunoblotting of cytokeratin-18. Indirect immunofluorescence of cytokeratin 18 (green). Nuclei were stained with DAPI (blue). Bar = 100 μm. (D) RT-PCR analysis of cell markers in GRECs. RT-PCR analysis of MCT4, NHE1, PAT1, vH+ ATPas, and AE2; amplifications of GREC-specific markers were obtained using primers directed against (lanes 1–3) MCT4, 106 bp, (lanes 4–6) NHE1, 113 bp, (lanes 7–9) PAT1, 123 bp, (lanes 10–12) vH+ ATPas, 182 bp, and (lanes 12–15) AE2, 123 bp. M molecular weight standard in bp. The data were based on triplicate experiments.

