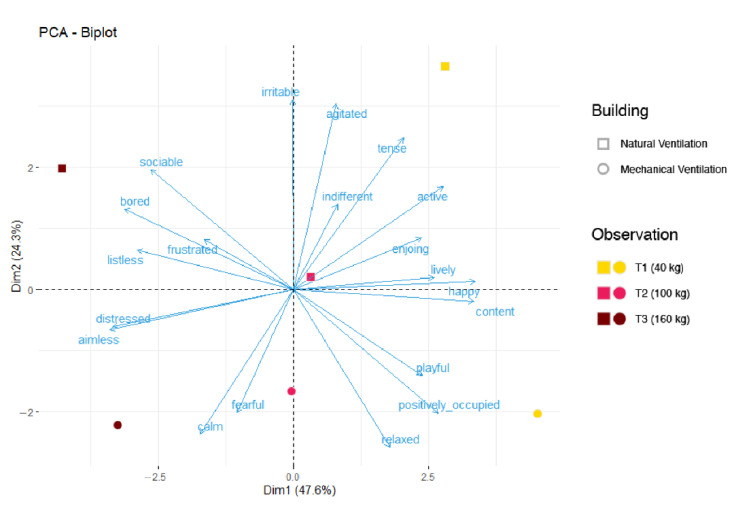
Figure 2.
Qualitative behavior assessment (QBA) analysis performed on the pigs. The QBA was performed following the indications of the Welfare Quality [23]. Descriptors and factors were analyzed using principal component analysis. The results of Dim1 (Principal component dimension 1) and Dim2 (Principal component dimension 2) are reported. One spot corresponded to one observation. The color of the spot indicates the observation: T1 (yellow, indicating pigs of 40 kg on average); T2 (pink, pigs of 100 kg of average); T3 (red, pigs of 160 kg on average). The shape of the spot corresponds to the building: square = pigs raised in naturally ventilated building; circle = pigs raised in the mechanically ventilated building.

