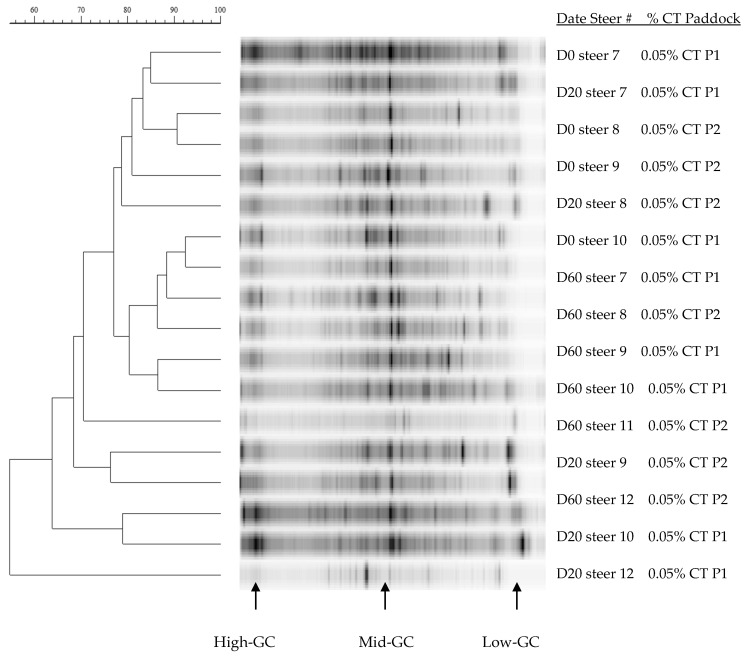
Figure 3.
Dendrograms of denaturing gradient gel electrophoresis gels (DGGE) of rumen bacteria 16S rDNA amplicon bands patterns in steers (n = 6) given winter wheat forage for day 0, day 20, and day 60 and containing 0.05% condensed tannins (CT; %/kg BW). P1 to P2 = each paddock (P). The bar above the figure indicates Dice percentage similarity coefficients (% SC). D = day, GC= guanines and cytosines, and Steer # = tag number (#).

