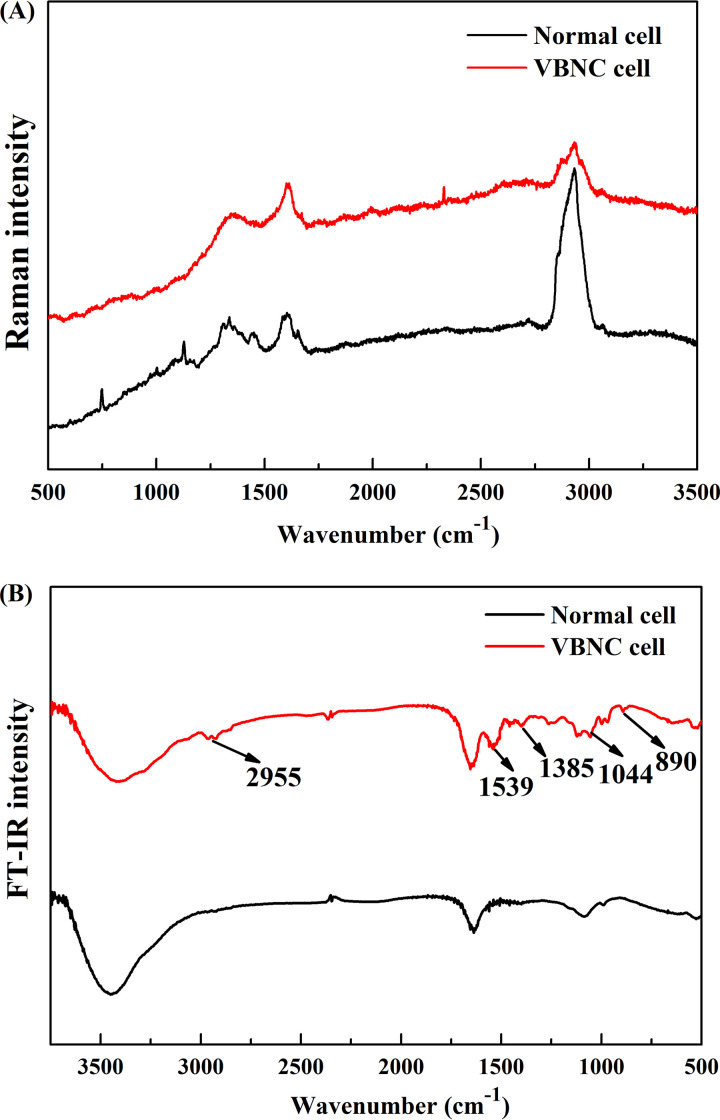
FIG 4.
Raman and FI-IR spectra of normal and VBNC cells of Candida sp. strain LN1. (A) Raman spectra of single cells. Twenty-one cells were randomly selected in each sample. The spectrum of each group is the mean for the 63 single cells, which were collected from triplicate experiments. (B) FI-IR spectra of normal and VBNC cells. The spectra are means from triplicate experiments.

