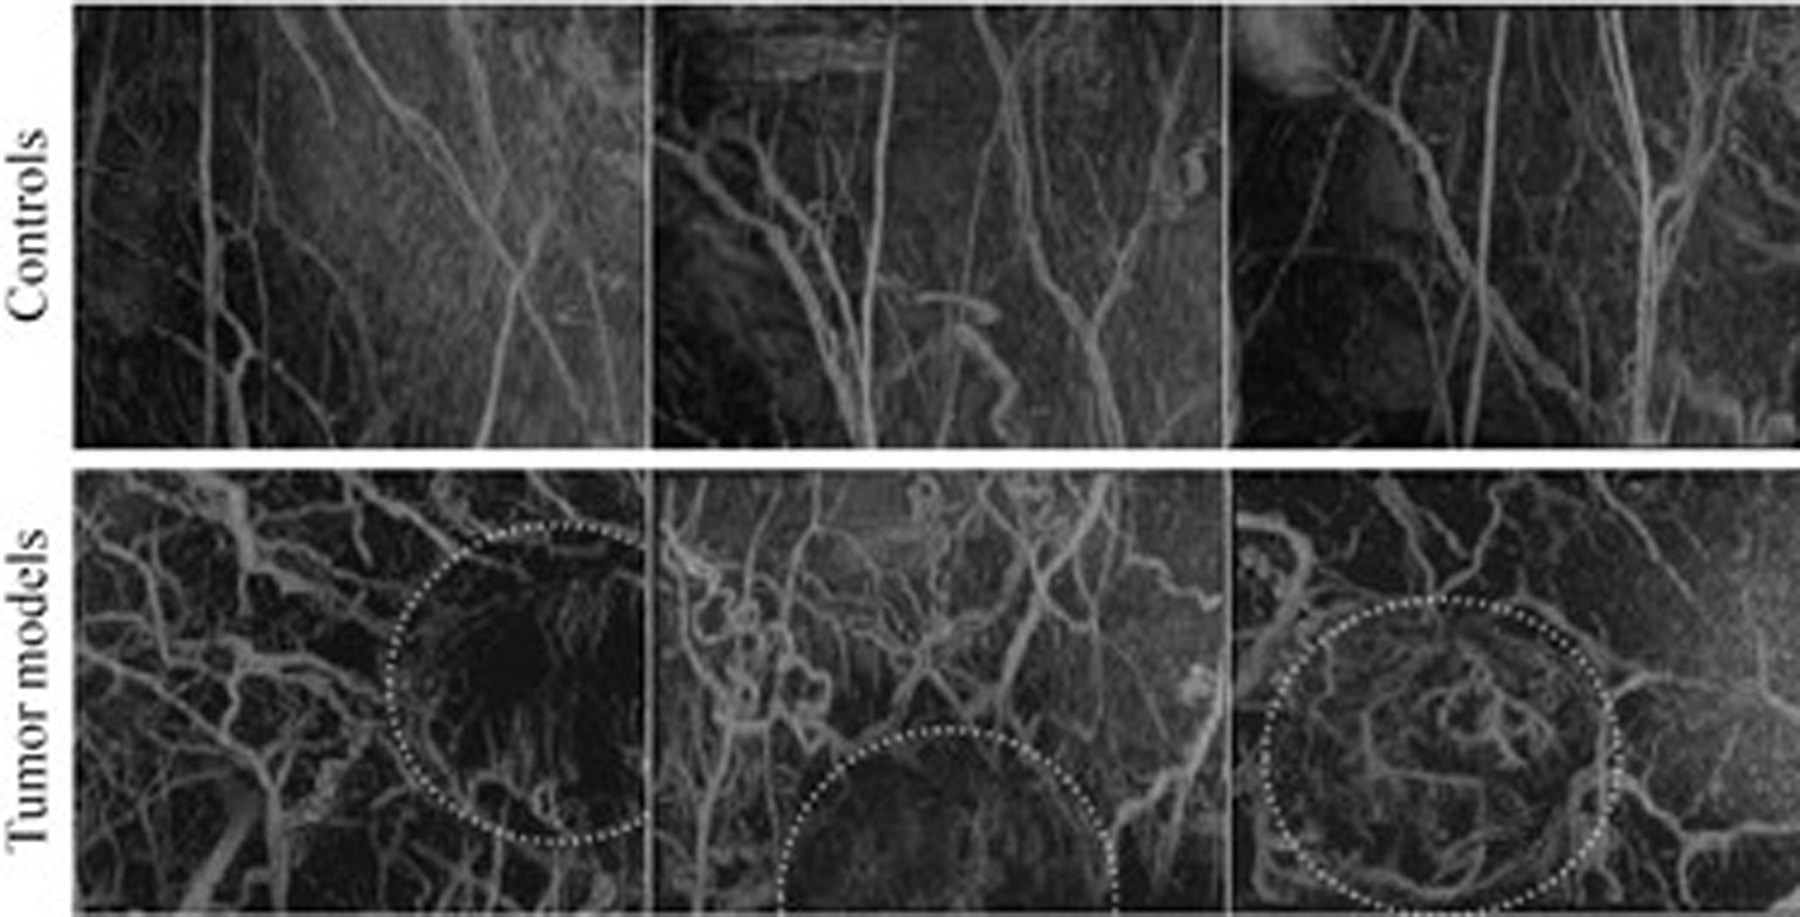
Figure 4.

Application of microvascular imaging to assess the angiogenic biomarker of cancer: Maximum intensity projections of 3-D acoustic angiography imaging of microvasculature for healthy (control) tissue and tissue surrounding fibrosarcoma tumors in a rat model. Dotted circles indicate approximate location of solid tumor mass, and field of view is approximately 2.5×2cm. Reproduced with permission from R. C. Gessner, S. R. Aylward, and P. A. Dayton, “Mapping microvasculature with acoustic angiography yields quantifiable differences between healthy and tumor-bearing tissue volumes in a rodent model,” Radiology, vol. 264, no. 3, pp. 733-40, Sep 2012 ©RSNA.
