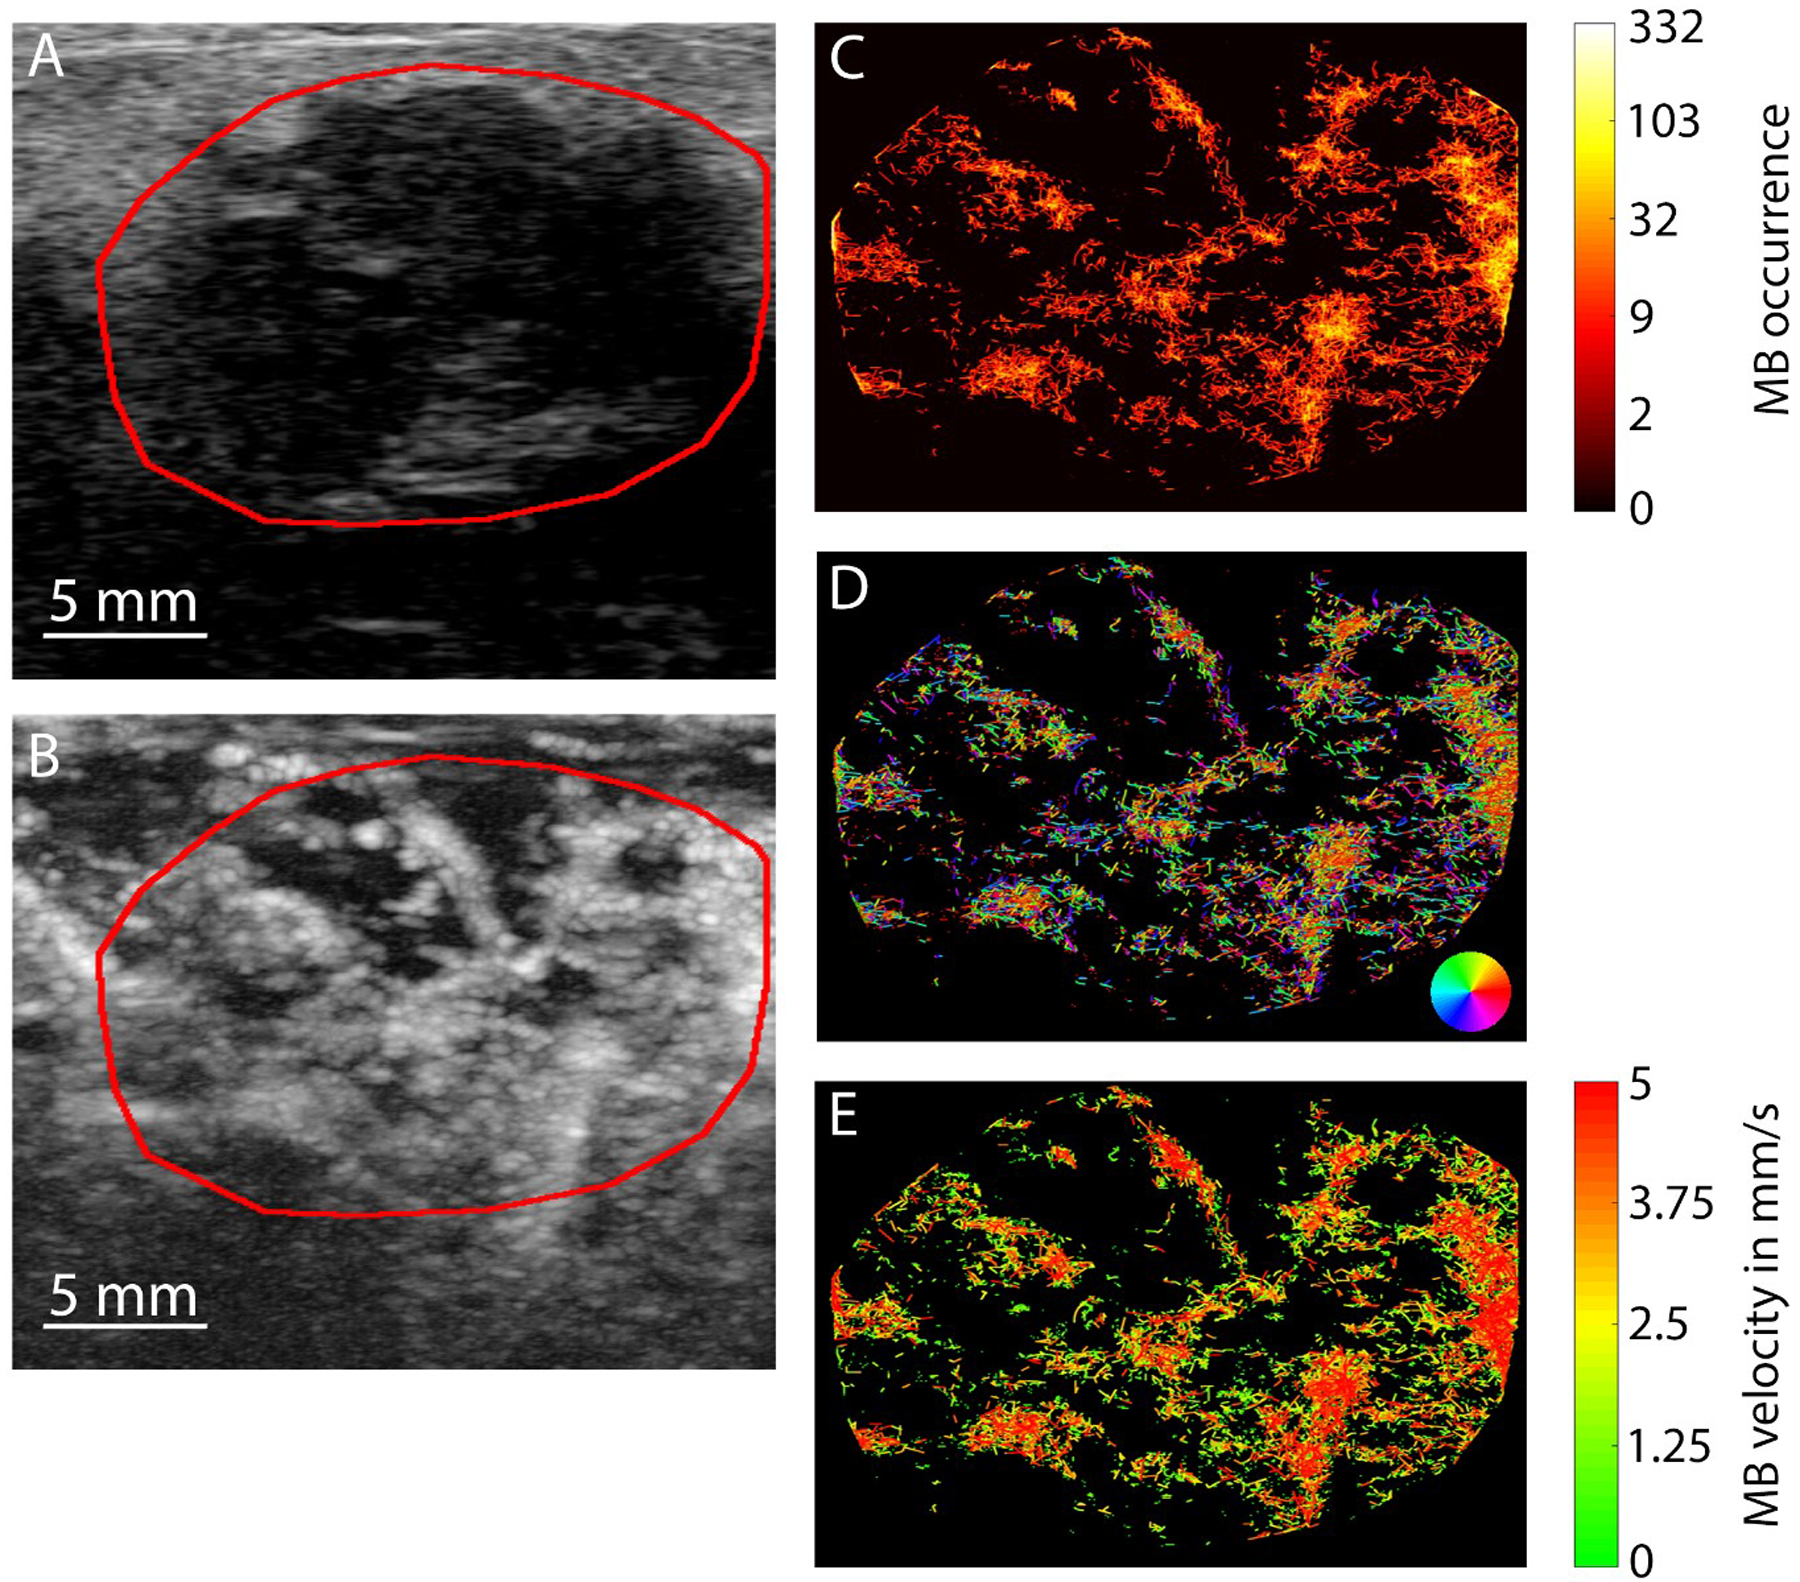
Figure 7:

B-mode image (A) of a breast cancer patient showing a hypointense, irregular lesion with unsharp margins. The MIP image after microbubble injection (B) confirms the lesion to be highly vascularized but details in the vascular architecture can hardly be captured. Profound information on the vascularization is available from the microbubble tracking analysis illustrating microbubble tracks (C), the directions of blood flow (D) and individual vessels’ velocities (E).
