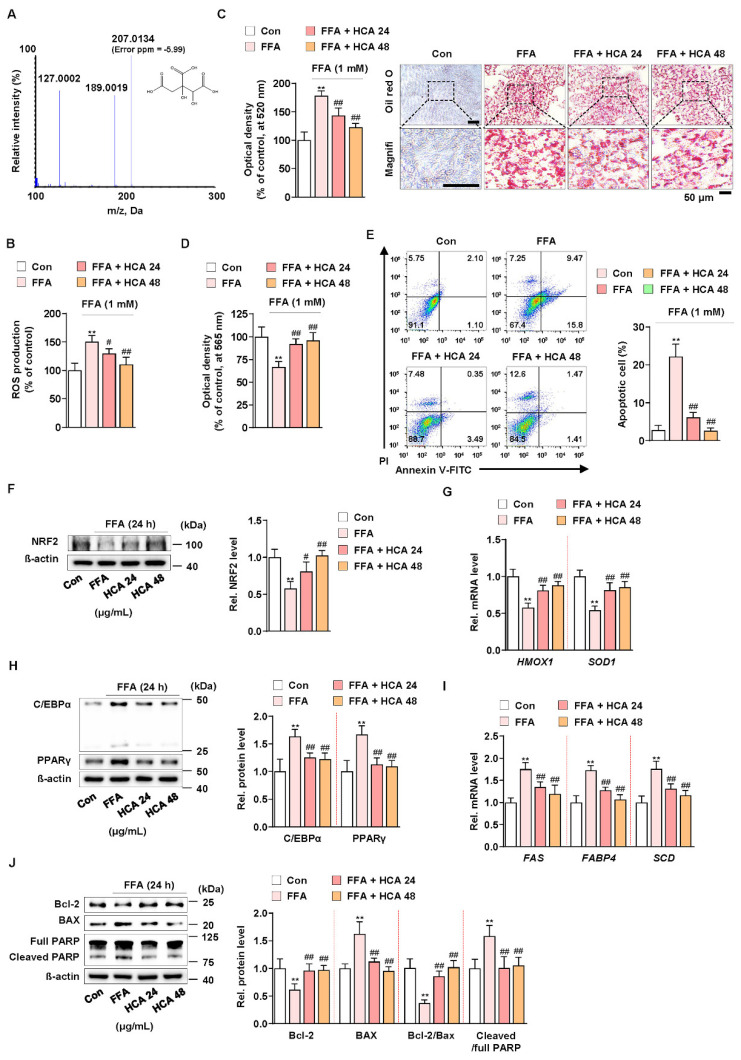
Figure 5.
Effect of hydroxycitric acid on FFA-induced ROS production, lipid accumulation, and apoptosis in HepG2 cells. (A) MS/MS spectrum of hydroxycitric acid [M − H]−. The parent ion was the deprotonated [M − H]− ion at m/z 207.0 and the most abundant ion in product ion scan mode. (B) ROS measurement using H2DCFDA in FFA-treated HepG2 cells treated with HCA (24 and 48 μg/mL) (n = 5 per group). (C) Oil red O assay and representative images showing the effect of HCA (24 and 48 μg/mL) on FFA-induced lipid accumulation in HepG2 cells. Cells were treated with HCA (24 and 48 μg/mL) for 24 h (n = 5 per group). Scale bar: 50 μm. Magnifi: magnification. (D) MTT assay showing the effect of HCA (24 and 48 μg/mL) on FFA-induced cell viability. Cells were treated with HCA (24 and 48 μg/mL) for 24 h (n = 5 per group). (E) Effect of HCA (24 and 48 μg/mL) on apoptosis in FFA-treated HepG2 cells. Cells were treated with HCA (24 and 48 μg/mL) for 24 h (n = 4 per group). The numbers of negatively and positively stained cells are expressed as percentages of the total number of cells. Effect of HCA (24 and 48 μg/mL) on the levels of (F) NRF2 expression, (G) HMOX1 and SOD1 transcriptions, (H) C/EBPα and PPARγ expression, (I) FAS, FABP4 and SCD transcriptions, and (J) Bcl-2 and BAX expression and PARP cleavage in FFA-treated HepG2 cells (n = 4 per group in f, h, and j; n = 5 per group in G,I). ** p < 0.01 vs. Con, # p < 0.05 and ## p < 0.01 vs. FFA. Data are mean ± S.D.

