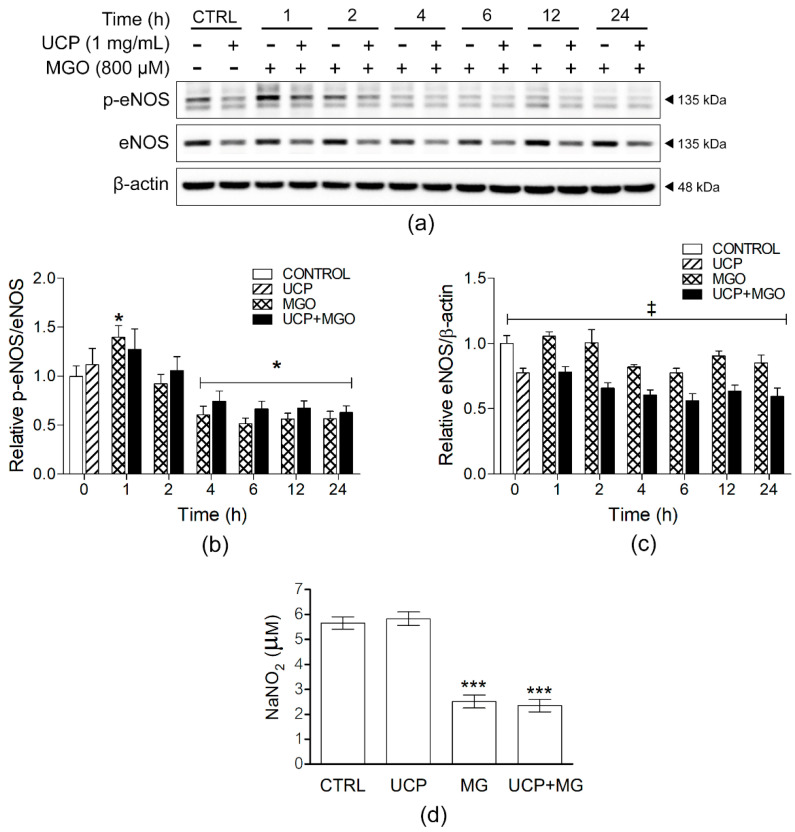
Figure 5.
Effects of UCP pretreatment on eNOS phosphorylation and nitric oxide levels in EA hy926 cell exposed MGO. (a) Representative Western blot protein bands of cell lysates from each sample group. (b) Relative ratios of p-eNOS/eNOS and (c) p-eNOS/β-actin. (d) NO releasing levels from cells in each treatment group. Data are presented as mean ± SEM. *, p < 0.05; ***, p < 0.001, when compared with vehicle-treated group; ‡, p < 0.05, when compared MGO-exposed group at the same time point.

