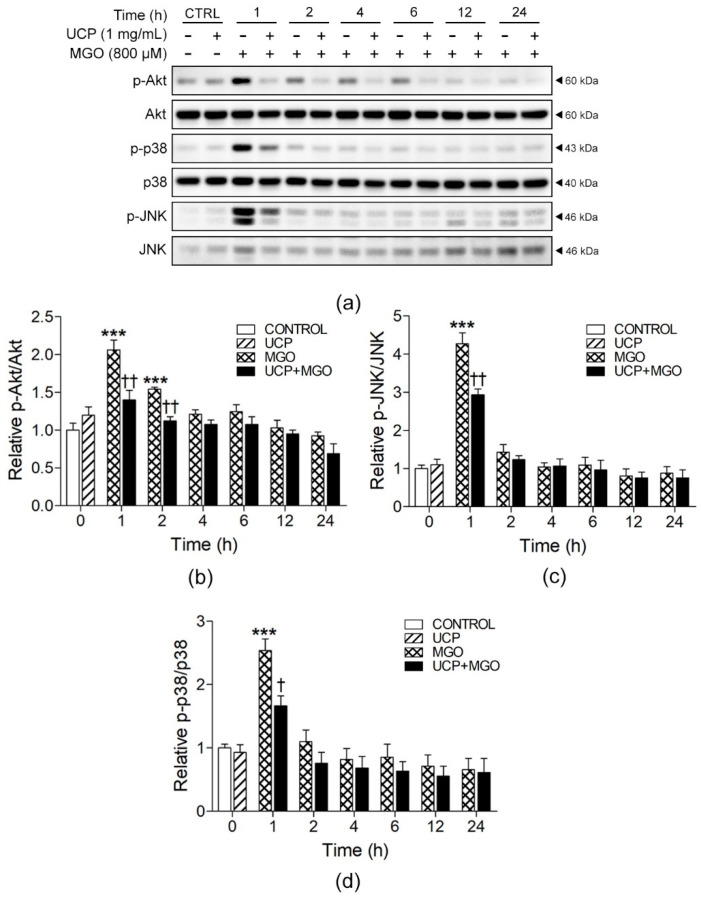
Figure 7.
Effects of UCP pre-treatment on MGO-induced cell survival and cell death pathways. (a) Representative Western blot protein bands. Relative ratios of (b) p-Akt/Akt, (c) p-JNK/JNK, and (d) p-p38/p38. Data are presented as mean ± SEM. ***, p < 0.001, when compared with each treated group; †, p < 0.05 and ††, p < 0.01, when compared MGO-exposed group at the same time point.

