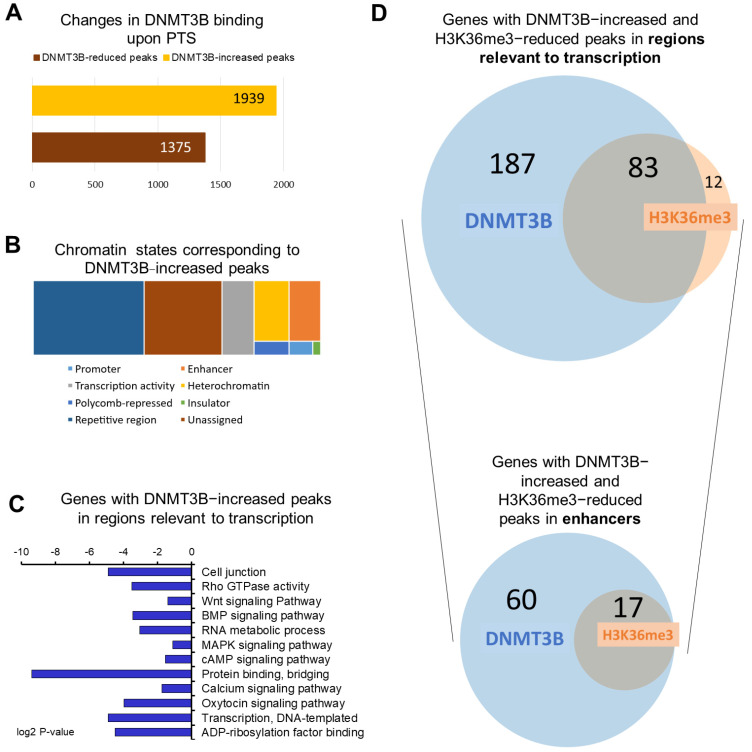
Figure 1.
Overview of genome−wide changes of DNMT3B binding in response to PTS. (A) A bar chart depicting the number of changes in DNMT3B binding in MCF10CA1a breast cancer cells treated with 7 μM PTS for 9 days. DNMT3B binding was assessed by ChIP sequencing. (B) Chromatin states associated with DNMT3B-increased peaks were determined using Broad ChromHMM data from human mammary epithelial cells (HMEC) available on USCS Genome Browser (hg19). Peaks could correspond to active, weak, or poised promoters, strong or weak enhancers, putative insulators, active or weak transcription, Polycomb−repressed regions, heterochromatin, or repetitive regions. (C) The 270 genes with DNMT3B-increased peaks in regions relevant to transcription upon PTS (i.e., promoters, enhancers, insulators, Polycomb-repressed regions, or heterochromatin) were subjected to Gene Ontology (GO) function and Kyoto Encyclopedia of Genes and Genomes (KEGG) pathway analysis using DAVID Knowledgebase. (D) Venn diagrams present an overlap between genes with DNMT3B−increased and H3K36me3-reduced peaks that were located in regions relevant to transcription and specifically in enhancer regions. The proportionally scaled Venn diagrams were generated using tools on www.stefanjol.nl/venny (accessed on 28 May 2021).

