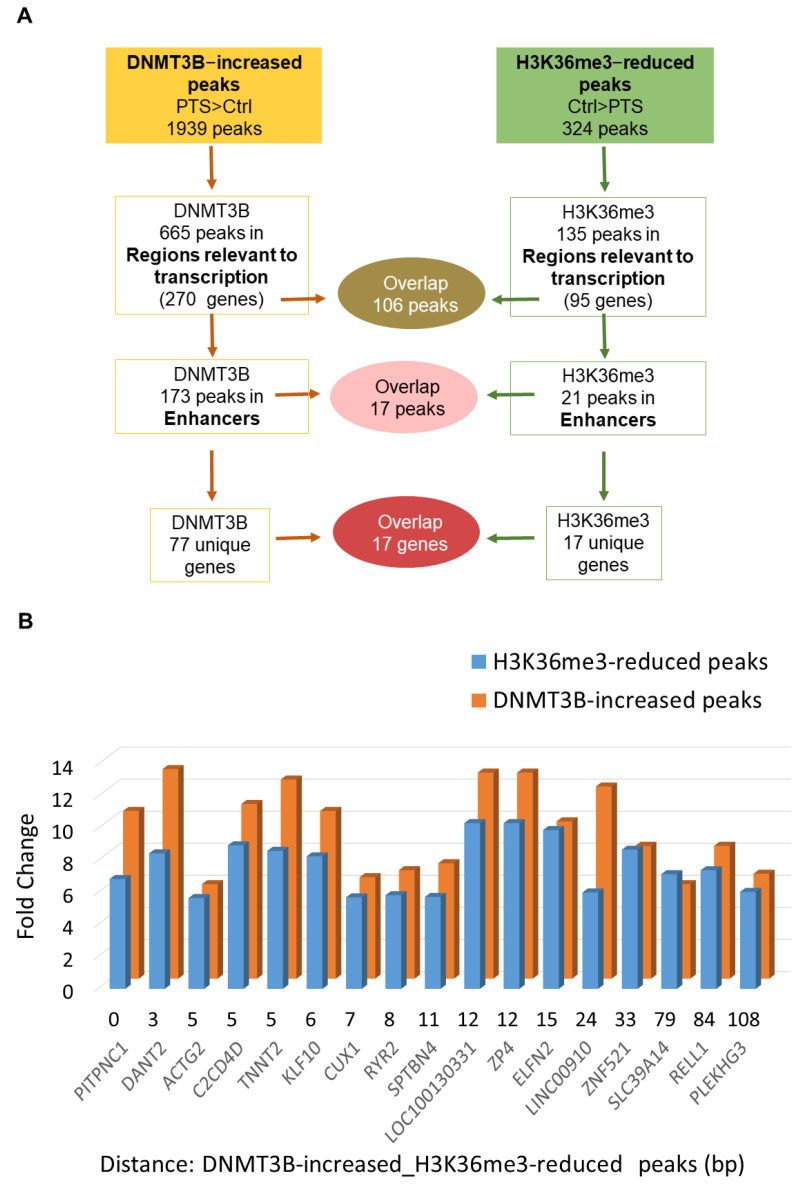
Figure 2.
Characterization of regions and genes that contain overlapping DNMT3B-increased and H3K36me3-reduced peaks in response to PTS. (A) Schematic of the analysis of peaks and genes associated with DNMT3B-increased and H3K36me3-reduced peaks in MCF10CA1a breast cancer cells treated with 7 μM PTS for 9 days. The overlap between peaks located within regions relevant to transcription (i.e., promoters, enhancers, insulators, Polycomb-repressed regions, or heterochromatin) and specifically enhancers is depicted along with the number of corresponding genes. (B) The 17 overlapping peaks located in enhancer regions and the corresponding genes are shown in the bar chart that computes a difference (fold change) in DNMT3B binding and H3K36me3 enrichment between PTS-treated and control cells (vehicle-treated, ethanol), along with the distance between DNMT3B-increased and H3K36me3-reduced peaks in a given gene. The presented results are based on ChIP-seq analyses.

