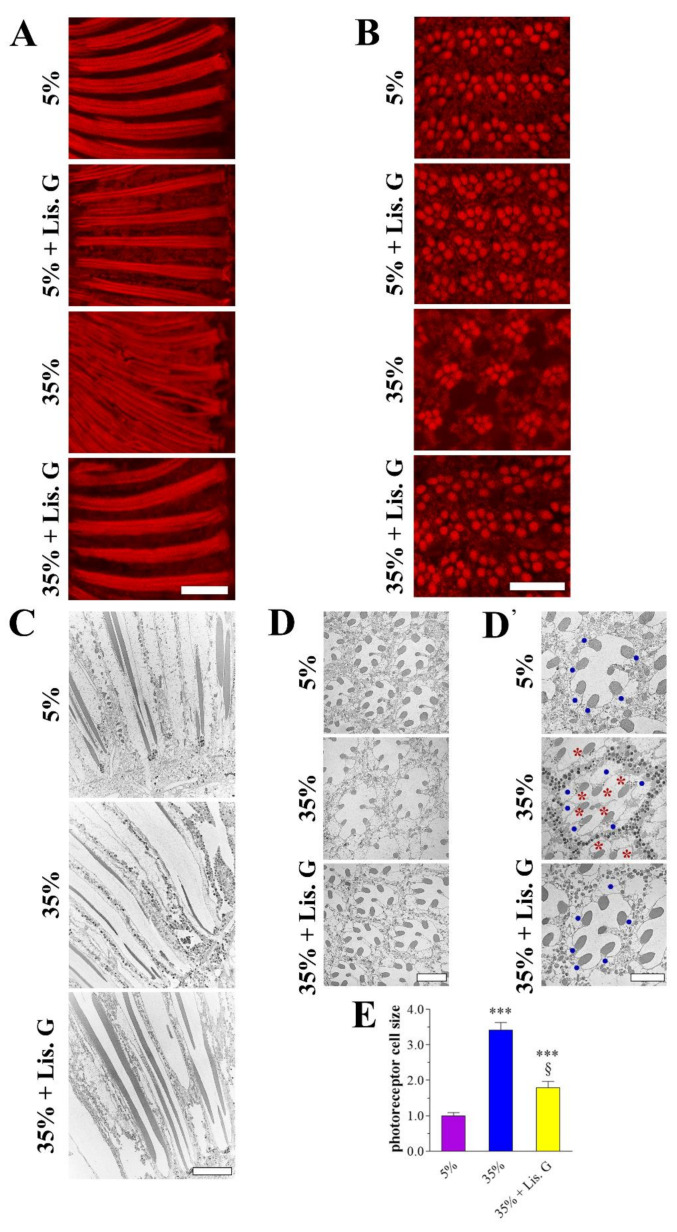
Figure 1.
Eye phenotype of adult D. melanogaster after 10 days feeding with 5% sucrose diet (control, normoglycemic flies) or supplemented with 35% sucrose (hyperglycemic flies), in the absence and in the presence of Lisosan G at 10 µg/mL. (A) Conventional (longitudinal sections) and (B) confocal (cross sections) microscopy analysis of Drosophila eyes stained with fluorescent phalloidin (F-actin staining) to detect rhabdomere morphology and the pattern of ommatidia and rhabdomeres, respectively. Scale bars: 20 μm (longitudinal) and 10 μm (cross). Images are representative of at least n = 30 animals obtained from 5 independent experiments. (C) Retina ultrastructure of columnar pattern by TEM analysis (longitudinal sections). Scale bar: 10 μm. (D) TEM micrographs of ommatidial cross sections. Scale bar: 5 μm. (D’) The higher magnification of different fields highlighted the alteration (size) of photoreceptor cell bodies (blue dots) and the presence of vacuoles (red asterisks). Please note that in the electron microscopic preparations, fixation and sectioning often led to the loss of the black pigment granule content that therefore appeared only in some images. Scale bar: 5 μm. (E) Quantitative analysis of photoreceptor cell size. Results are expressed by setting the mean cell area of 5% normoglycemic control as 1. *** p < 0.0001 vs. 5% control; § p < 0.01 vs. 35% sucrose. Images and data are representative of at least n = 15 animals obtained from 4 independent experiments.

