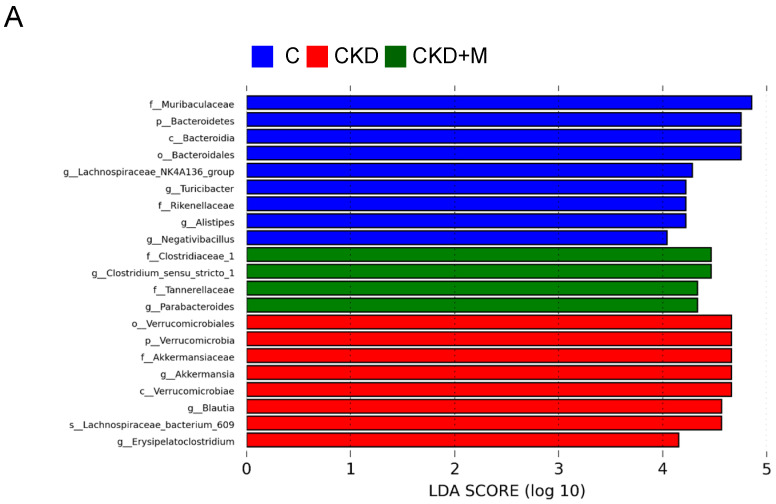
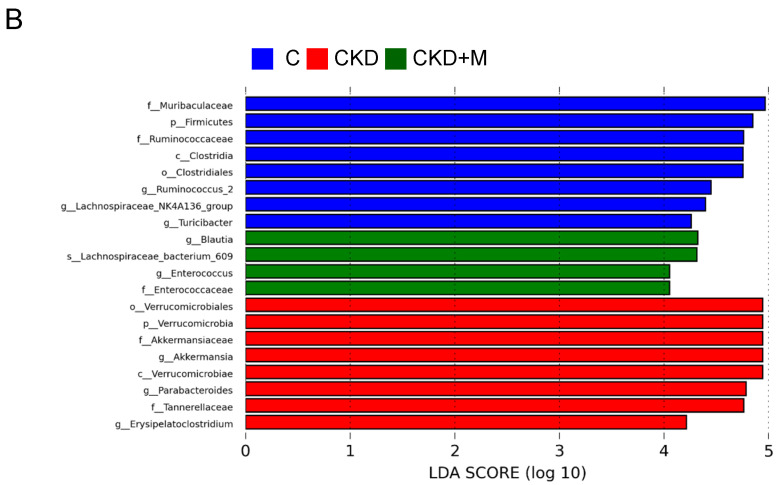
Figure 5.
Linear discriminant analysis effect size (LEfSe) was applied to microbial marker discovery in metagenomic data. Here, are the most enriched and depleted bacterial taxa in (A) males and (B) females. C (blue) versus CKD (red) and CKD + M (green) are shown. Different taxonomic levels of bacteria are given, reaching from phylum down to the genus level. The threshold of the linear discriminant was set to four.


