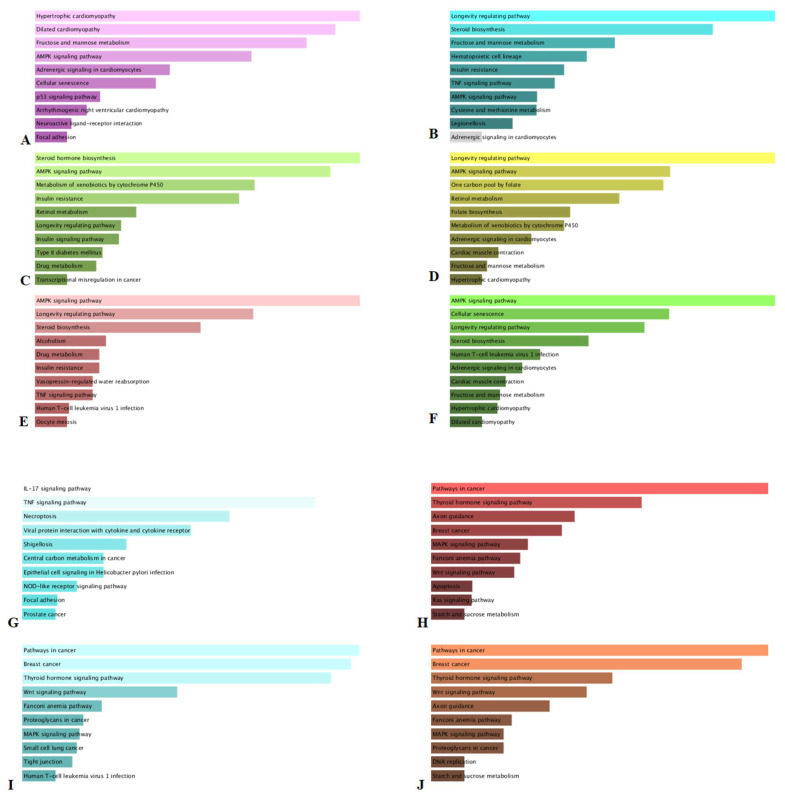
Figure 6.
Top 10 KEGG pathway enrichment for the selected compounds. The bars in the panels represents the p-values computed using the Fisher exact test. The longer bars and lighter colored bars mean that the term is more significant. (A) artabsin; (B) dehydroleucodin; (C) dihydrosantamarin; (D) leucodin; (E) matricin; (F) tanaparthin peroxide; (G) neochlorogenic acid and chlorogenic acid; (H) homoorientin; (I) vitexin; (J) isovitexin.

