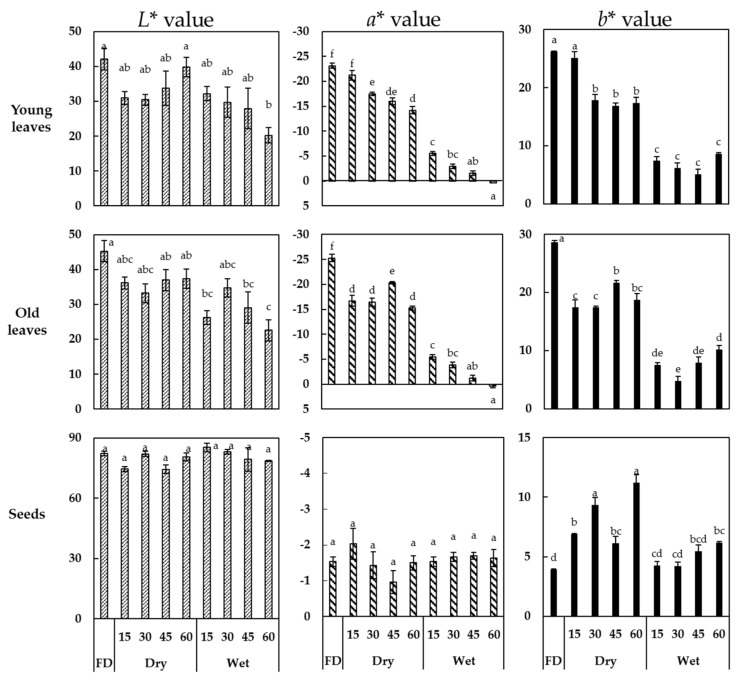
Figure 2.
Color parameters (CIE L*, a*, b*) of young and old faba leaves and faba seeds after thermal treatment. FD indicates freeze-dried samples. Dry and wet indicates dry heat and steaming treatments, respectively, with numbers indicating treatment times of 15, 30, 45 and 60 min. Different letters indicate a significant difference between mean values of color parameters at p < 0.05 (Tukey’s HSD test).

