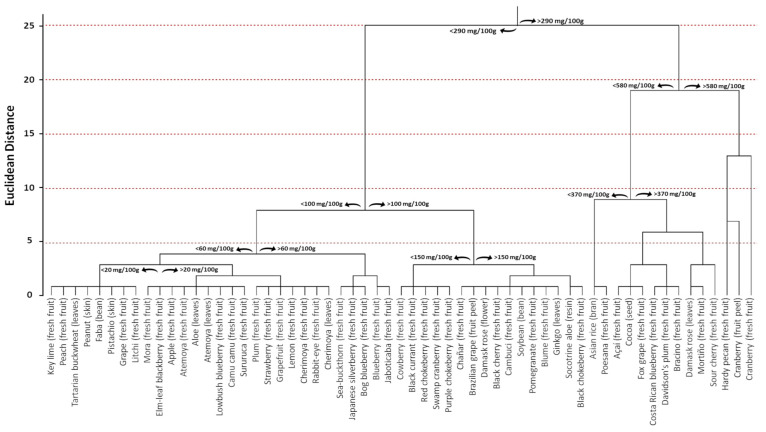
Figure 13.
Cluster distribution of proanthocyanidins in plant kingdom based on the total proanthocyanidin content according to previously published data [87,88,90,91,92,93,95,96,107,108,109,110,111,112,113,114,115,116,117,118,119,120,121,122,123,124,125,126,127,128,129,130,131,132,133,134,135,136,137,138,139]. Euclidean distances were calculated with the average linkage method. Statistical analysis and graphical representation were made using SPSS v. 24 software. 7. PAC Availability.

