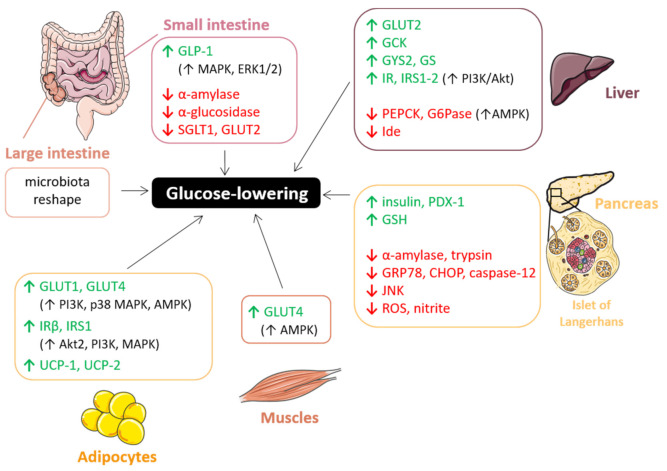
Figure 15.
Schematic representation of the molecular mechanisms through which PACs affect glucose metabolism protecting against hyperglycemia. ↑ increase; ↓ decrease. The figure was created using Servier Medical Art by Servier (smart.servier.com, accessed on 12 March 2021), licensed under a Creative Commons Attribution 3.0 Unported License).

