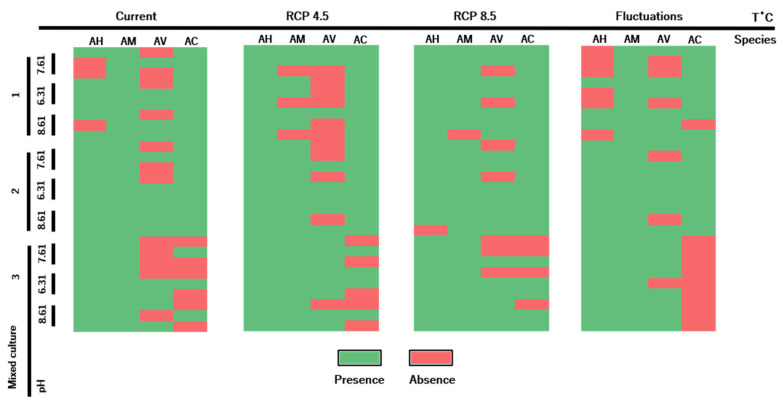
Figure 3.
Prevalence of Aeromonas species in the mixed cultured wells after the microcosm assay. Each line corresponds to a distinct replicate belonging to one of the pH treatments (7.61, 6.31 and 8.61) from the tested mixed cultures (#1, #2 and #3). Each column represents an Aeromonas species (AH—A. hydrophila, AM—A. media, AV—A. veronii, AC—A. caviae) from a specific temperature treatment (Current, RCP 4.5, RCP 8.5 and Fluctuations).

