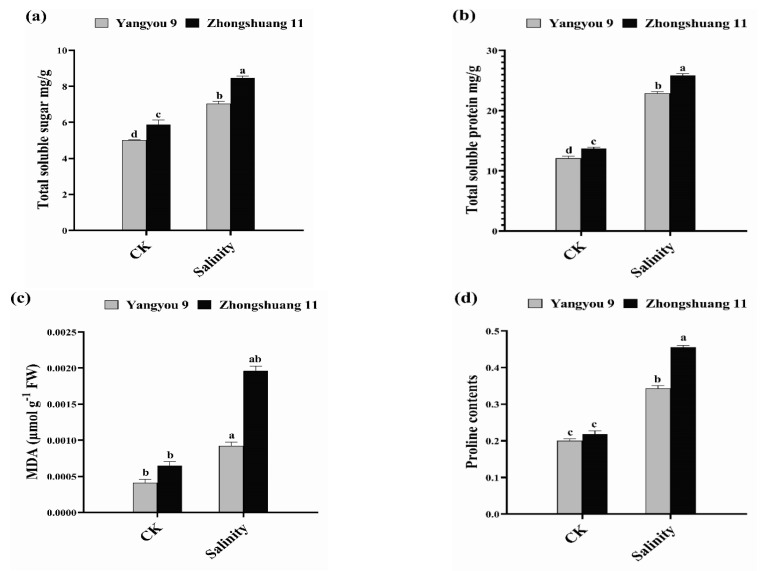
Figure 3.
Modifications in (a) total soluble sugar, (b) total soluble protein, (c) MDA, and (d) proline content under normal and salt conditions induced by 150 mM NaCl. Bars represent ±SE of three replicates. Letters (a, b, c and d) on vertical bars represent significant differences between cultivars and treatments according to Duncan’s multiple range test (DMRT) at p < 0.05.

