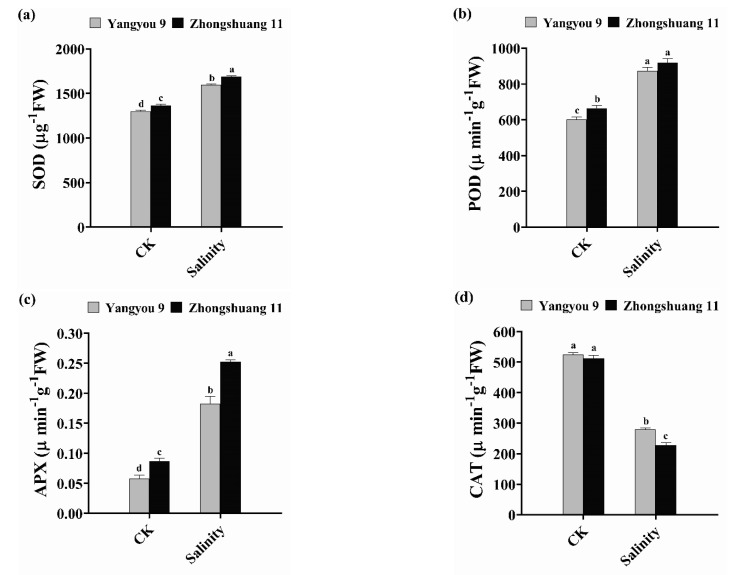
Figure 5.
Modifications in (a) superoxidase (SOD), (b) peroxidase (POD), (c) ascorbate peroxidase (APX), and (d) catalase (CAT) activity under normal and salt conditions induced by 150 mM NaCl on fresh samples. Bars represent ±SE of three replicates. Letters (a, b, c and d) on vertical bars represent significant differences between cultivars and treatments according to Duncan’s multiple range test (DMRT) at p < 0.05.

