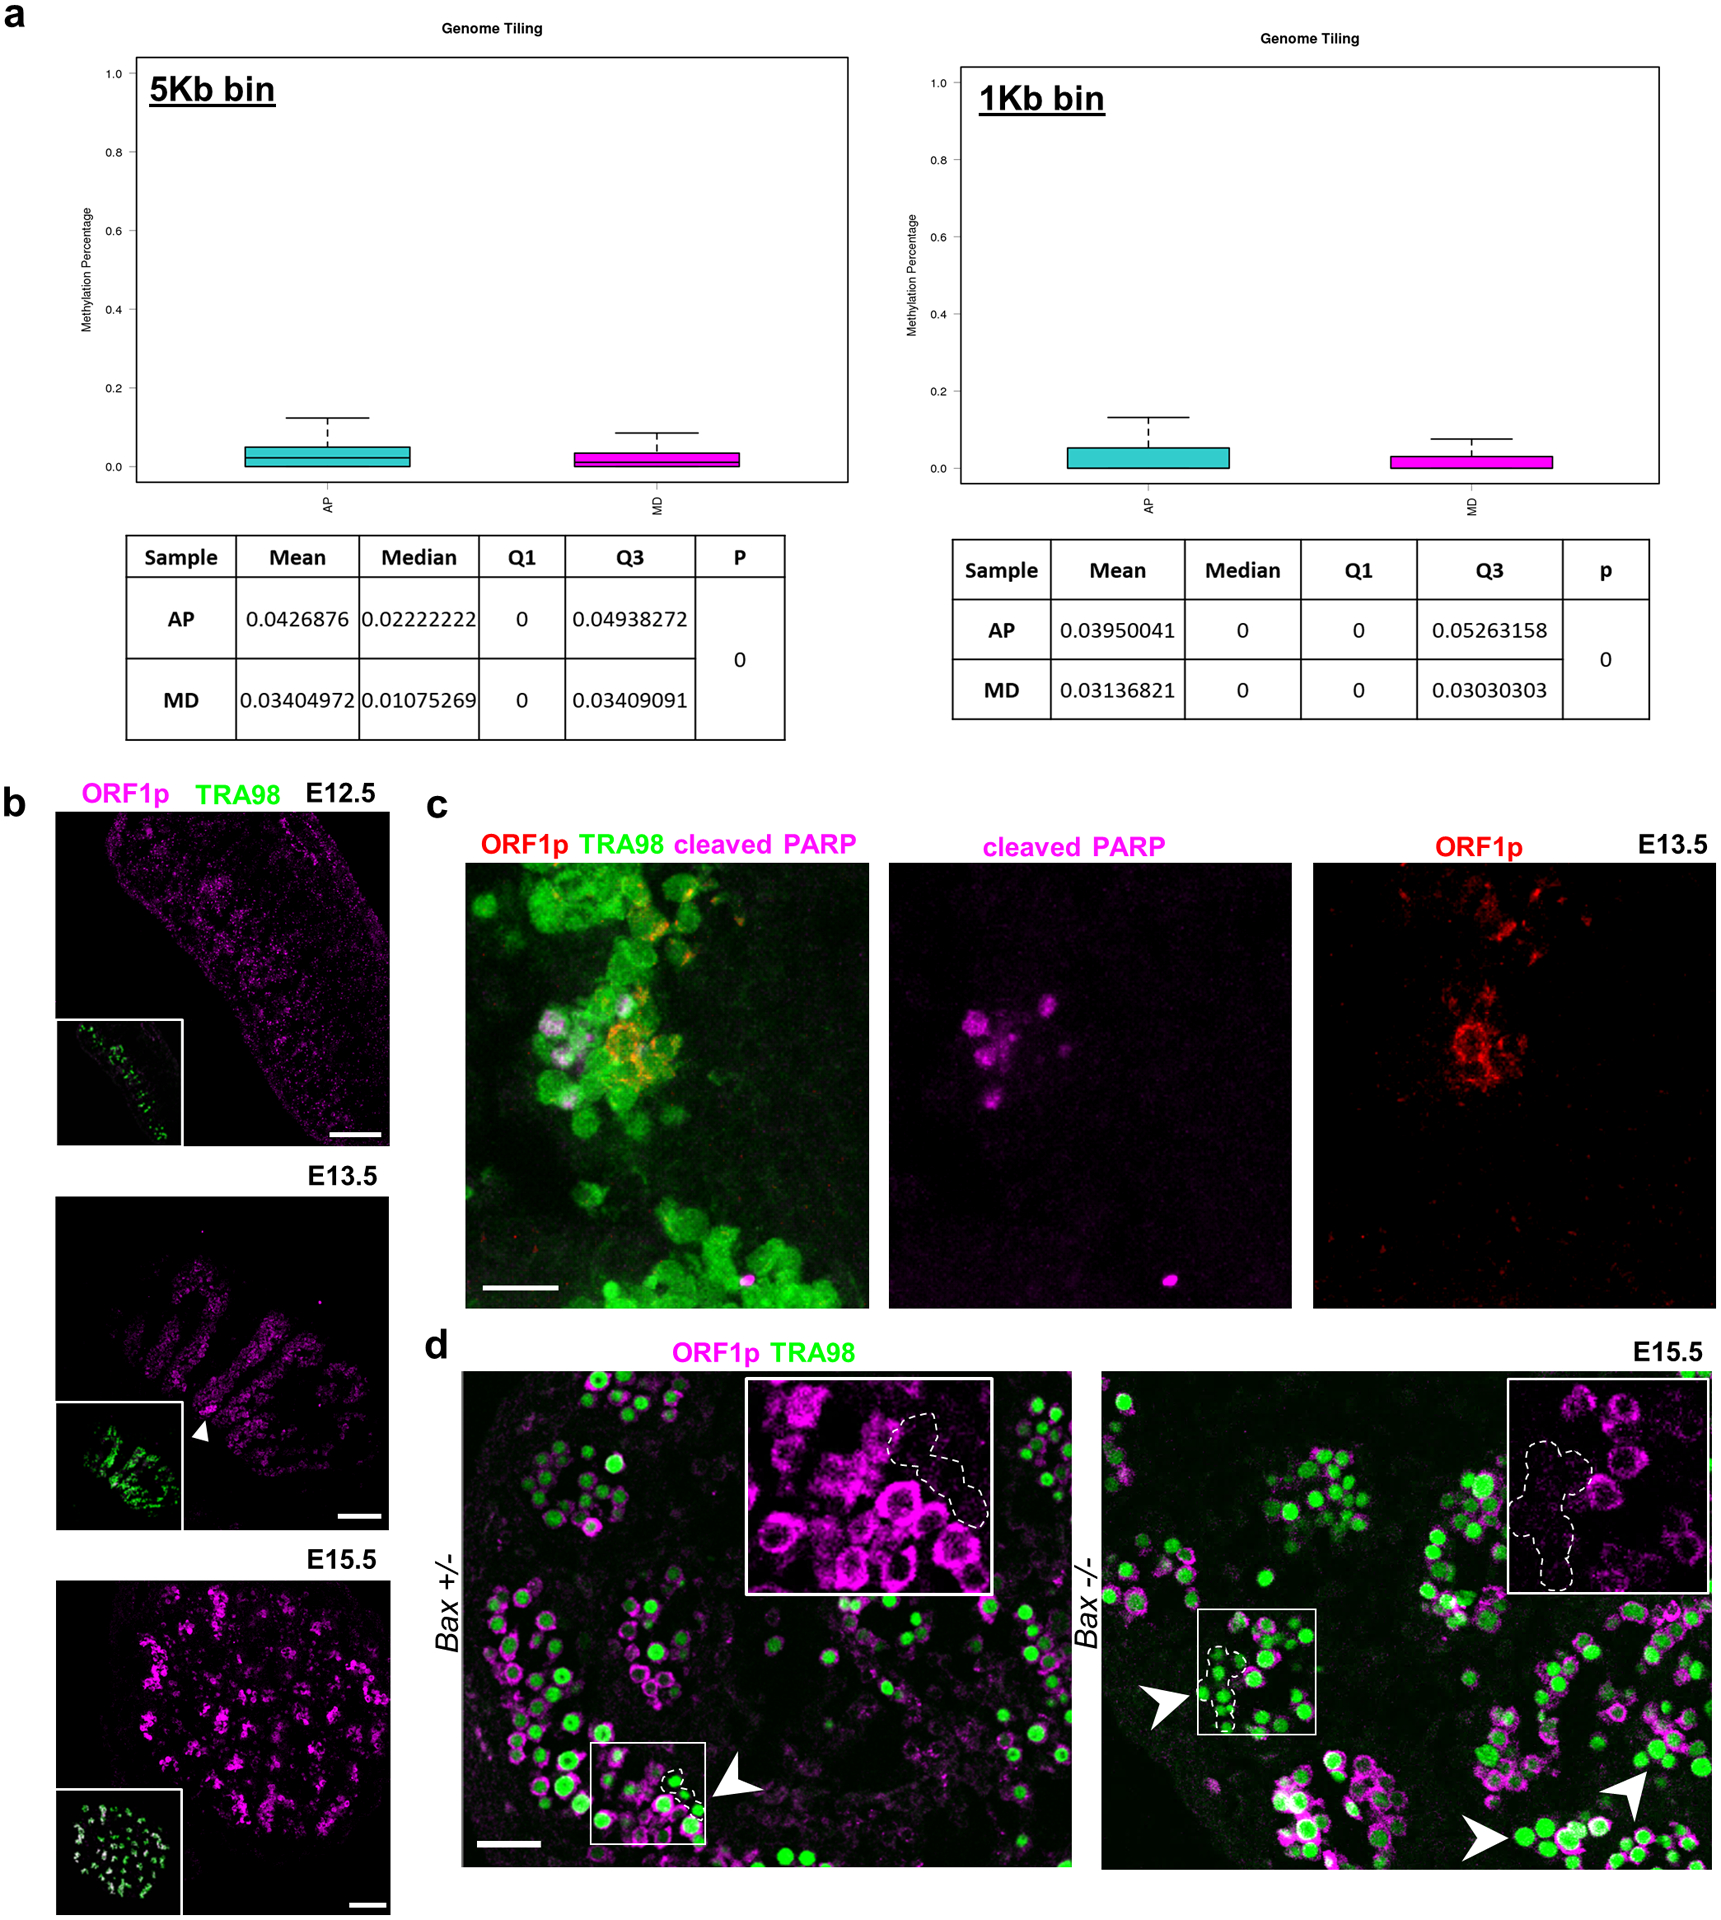
Extended Data Fig. 9. Population-specific expression of epigenetically-regulated genes including LINE1 during male differentiation.

a, Whole-genome bisulfite sequencing comparison of sorted AP and MD populations for relative methylation percentage. Data are presented as median values with first and third quartiles. Whiskers represent minimum and maximums. Sequencing was performed on 2 separate runs of n=2,000 and n=6,000 cells each for both populations. b, ORF1p expression during apoptotic wave. ORF1p is expressed in small clusters of germ cells at E13.5 (white arrowhead) and progresses toward homogenous expression by E15.5. Scale bar = 100μm. c, ORF1p and cleaved PARP staining in E13.5 wild type sections. Scale bar = 25μm. d, ORF1p-negative germ cell clusters in E15.5 Bax−/− compared to Bax+/−. Arrowheads denote ORF1p-negative cells. Insets: Higher-magnification image of ORF1p-negative cluster compared to ORF1p-positive neighboring germ cells. Scale bar = 50μm.
