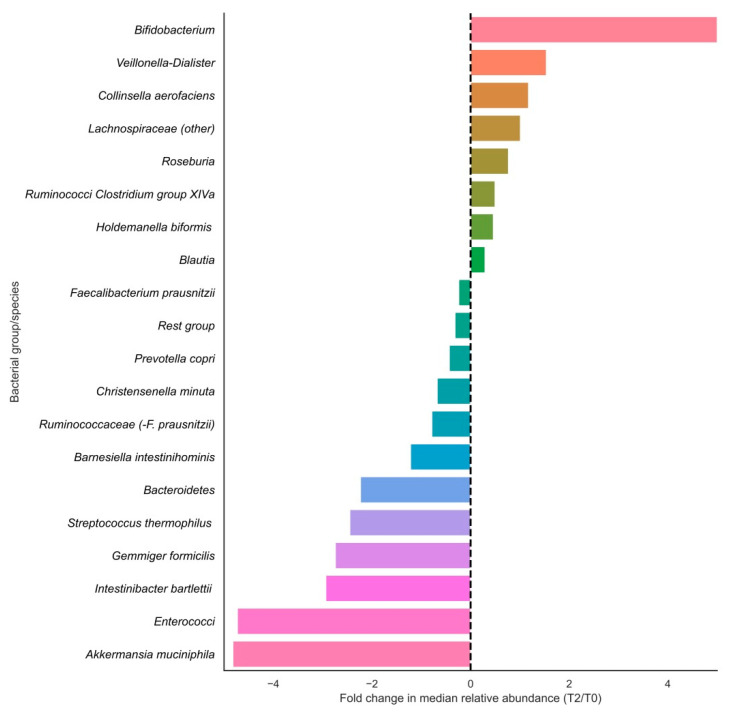
Figure 2.
Fold changes in relative abundances (%) of bacterial groups before and after vitamin C supplementation. Bars indicate fold changes of bacterial groups after supplementation (T2) compared to the relative abundance at baseline (T0). Relative increases in bacterial abundance are depicted on the right side of the plot, whereas decreases are shown on the left side of the plot. Bacterial groups are sorted on fold change sizes.

