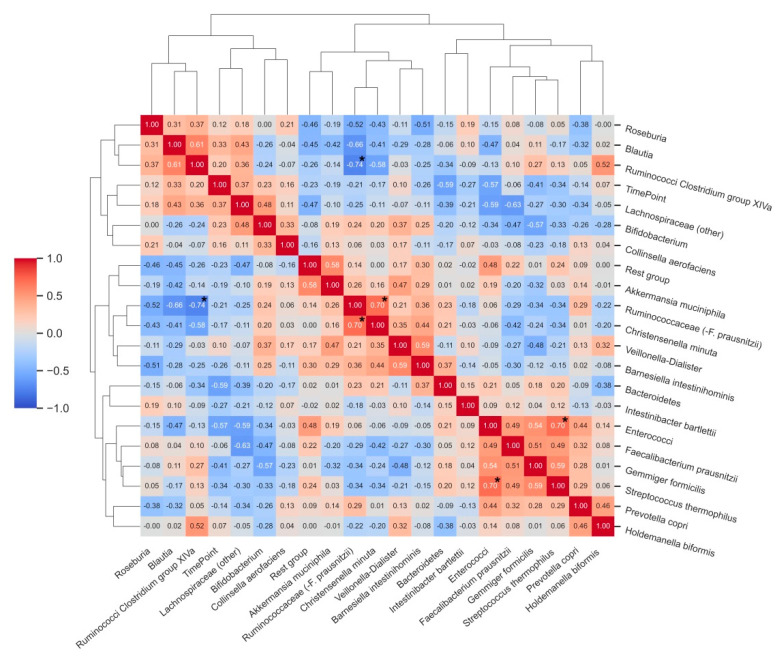
Figure 4.
Correlation matrix heatmap demonstrating correlations between relative abundances (%) of bacterial groups before and after vitamin C supplementation. Time point (T0 and T2) was included as an additional variable to the correlative clustering as well as to demonstrate associations between bacterial groups and changes upon intervention. Dendrograms represent hierarchical agglomerative clustering based on Euclidean distances (same as in Figure 3). * Bold asterisks indicate statistically significant correlations after adjustment for multiple comparisons.

