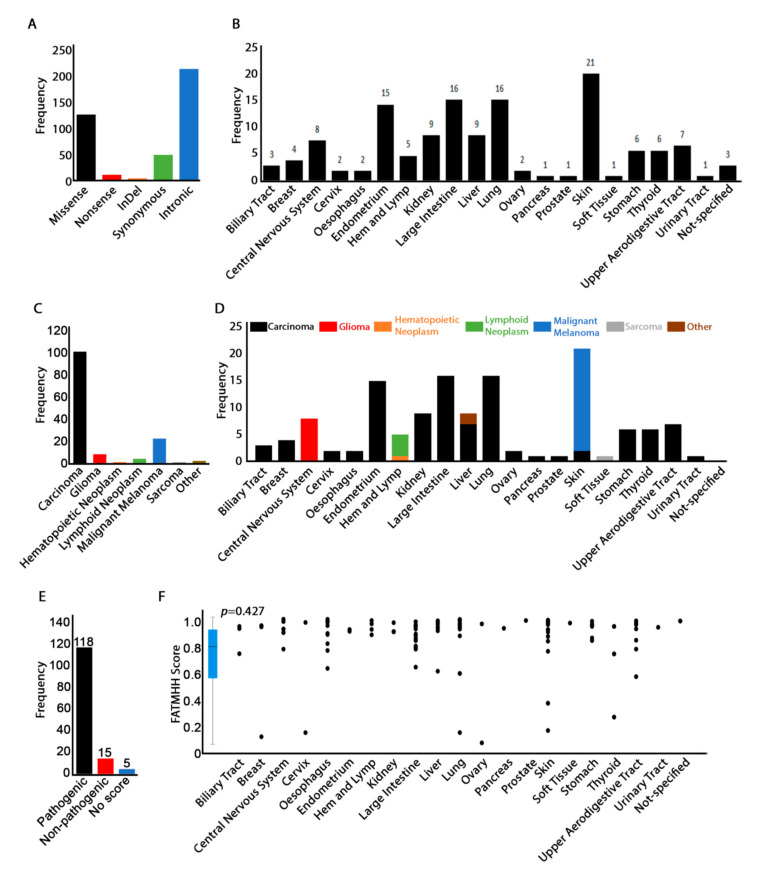
Figure 1.
Distribution of DGAT2 mutations in cancer samples. (A) Frequency of mutation types in all cancer samples reported on COSMIC. “Intronic” mutations also include 5′ and 3′ UTRs. (B) Tissue distribution of missense, non-sense and indel mutations. Synonymous, intronic and UTR mutations were excluded from this analysis as they are not likely to change the function of the gene. The panel follows the same color coding as in (A). (C) Distribution of missense, non-sense and InDel mutations by cancer histology. (D) Distribution of cancer histology by tissue. This panel follows the same color coding as in (C). (E) Frequency of missense, non-sense and InDel pathogenic mutations. (F) Scatter graph to show tissue correlation with the FATMHH score. The distribution of the FATHMM score was also graphed as a boxplot for easy visualization of median and quartiles. Probability values represent Pearson’s two-tailed significance.

