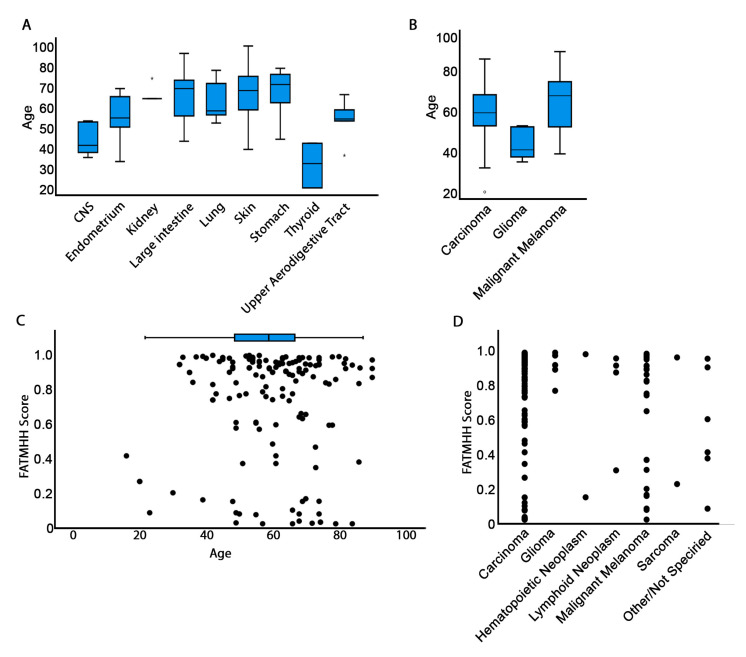
Figure 2.
Correlation of patient age with mutation pathogenicity. (A) Age and tissue distribution of mutations. (B) Age and histology distribution of mutations. Only tissues for which at least five samples were reported were included in (A) and (B). Complete data are reported in Figure S2. For A and B, circles represent outliners and asterisks extreme values. (C) Scatter graph to show the correlation of FATMHH pathogenicity score and age. (D) Scatter graph to show the distribution of FATMHH pathogenicity score by cancer histology.

