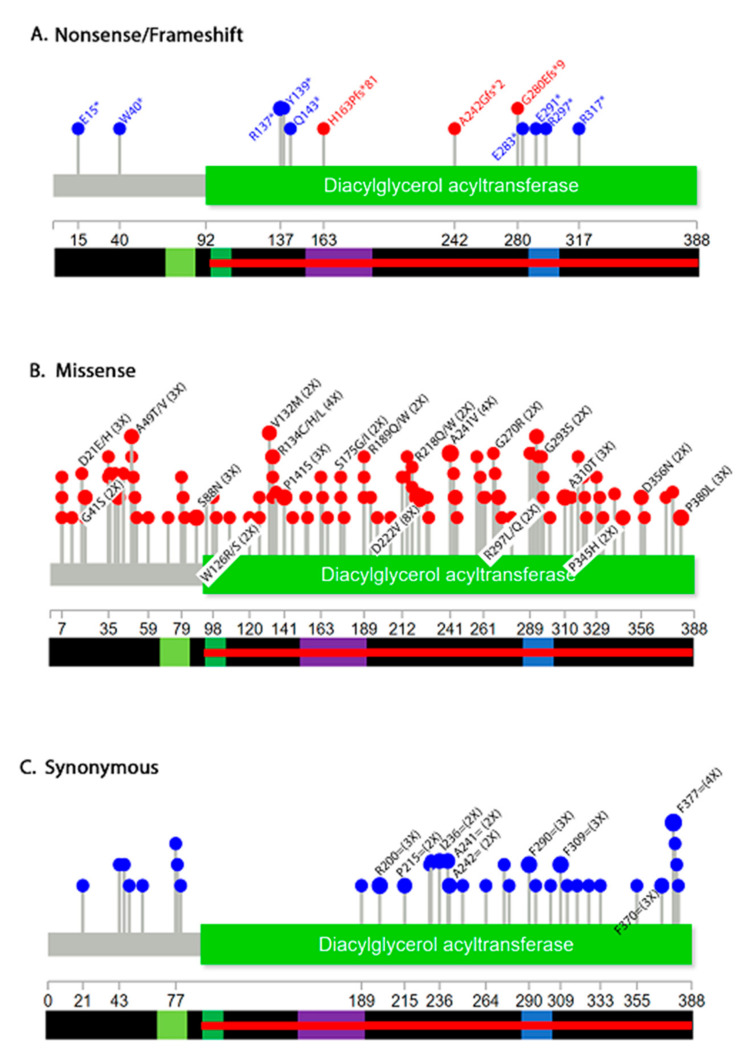
Figure 4.
Distribution of DGAT mutations by mutation type. Shown are non-sense (blue) and frameshift (red) (A), missense (B) and synonymous (C). Only mutations that appear more than twice are labeled. Complete data is shown in Supplementary Table S2.

