Figure 3.
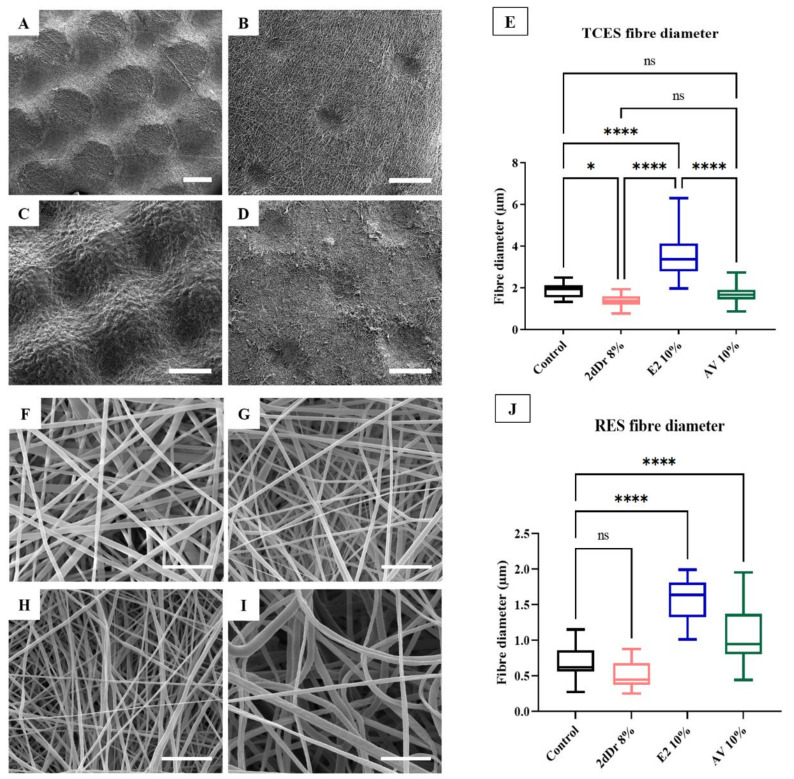
SEM micrographs of PCL TCES fabricated using the same patterned collector. (A) Control, (B) 8% 2dDr, (C) 10% E2, and (D) 10% AV. (E) Box plot of the TCES fiber diameter. SEM micrographs of PCL RES. (F) Control, (G) 8% 2dDr, (H) 10% E2, and (I) 10% AV. (J) Box plot of the RES fiber diameter. ns = no significance, * p < 0.05, **** p < 0.0001. N = 3, n = 15.

