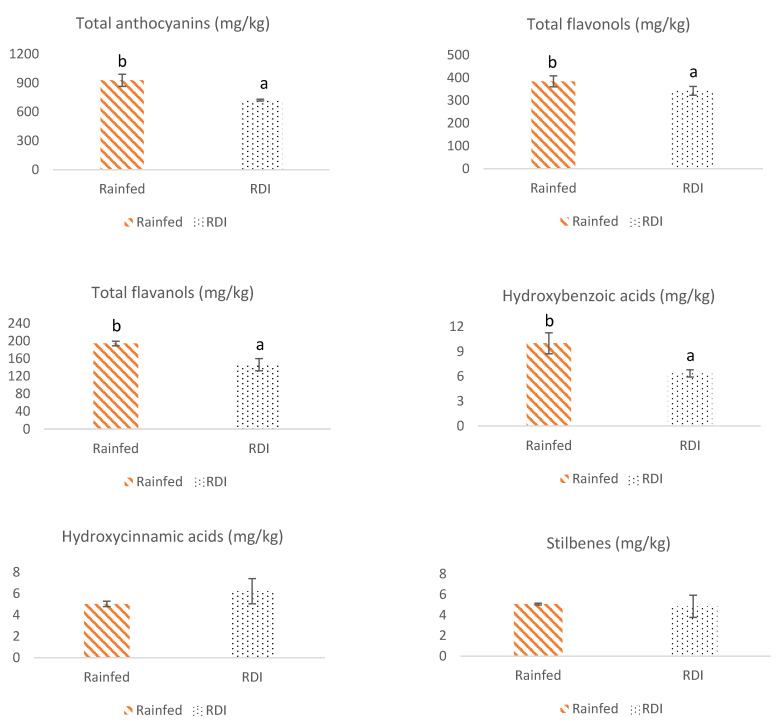
Figure 1.
Mean values of total phenolic compounds and total content (mg/kg) of different groups of phenolic compounds in Monastrell grapes. Bars represent the standard deviations (n = 4). Different letters (a and b) indicate significant differences between grapes under non-irrigation (rainfed) and regulated deficit irrigation (RDI) regimes (p ≤ 0.05). When there is no difference between treatments (p > 0.05), no significance letters are shown.


