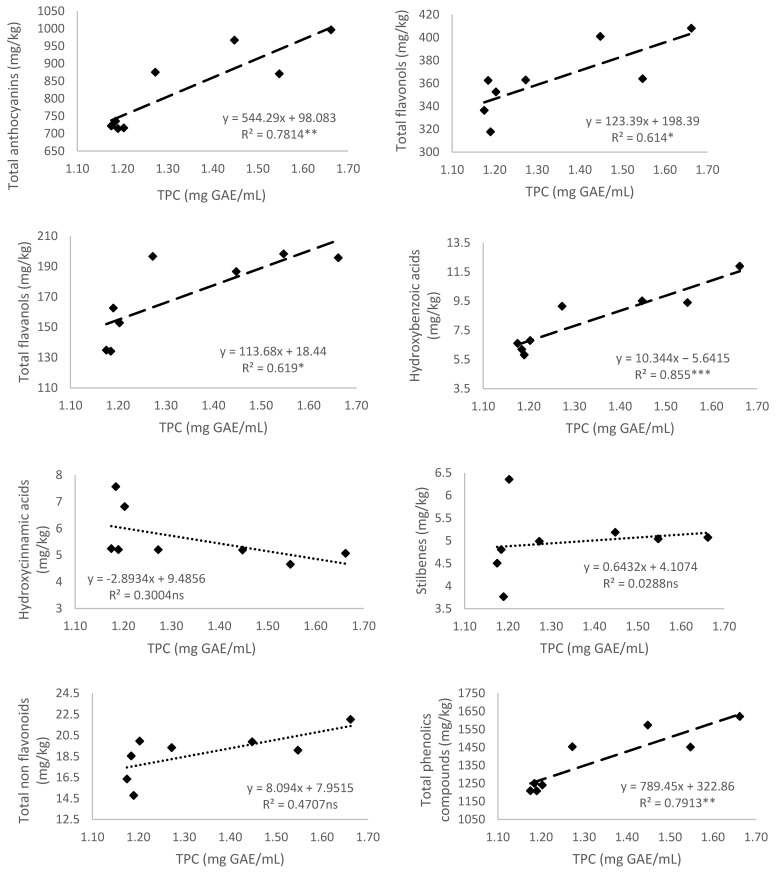
Figure 2.
Relationship of the total phenolic content (TPC) (mg GAE/mL) and total anthocyanins, flavonols, flavanols, hydroxybenzoic and hydroxycinnamic acids, stilbenes, non-flavonoids, and content of total phenolic compounds (mg/kg) of Monastrell grapes. Values of the coefficient of determination (R2) are presented. Lines of linear regression are shown: (- - -) when relationships are significant (p < 0.05, *; p < 0.01, **; and p < 0.001, ***), or (⋯) when there are no significant differences (p > 0.05, ns).

