Figure 2.
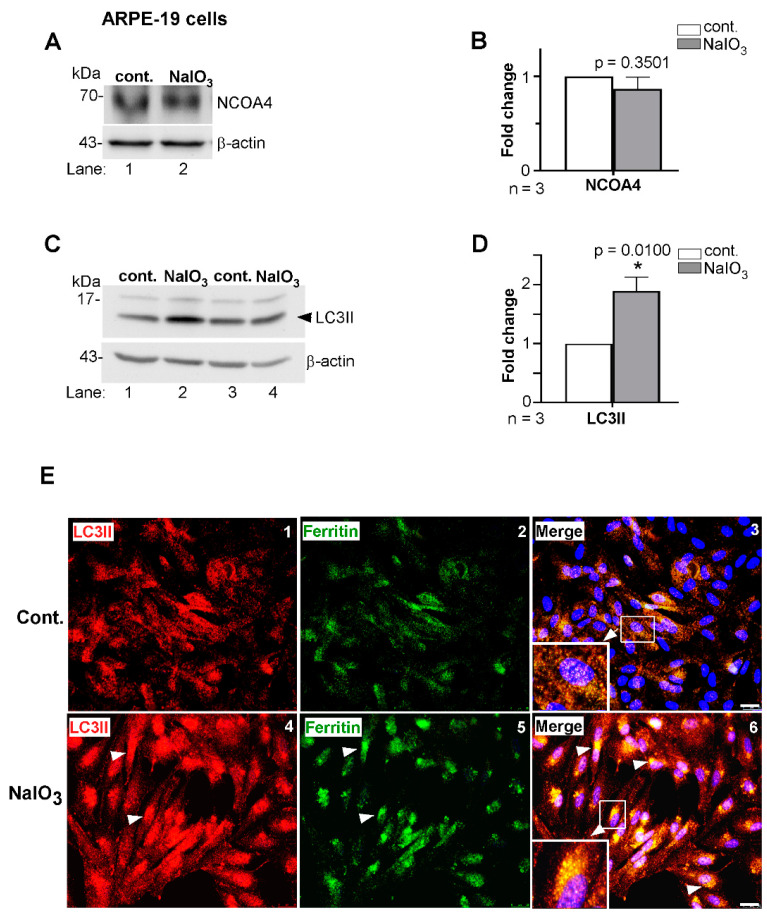
Ferritin accumulates in autophagosomes in NaIO3-treated cells. (A) Probing of lysates from NaIO3 treated and control cells as above for nuclear receptor coactivator 4 (NCOA4) showed no difference in expression between the experimental and control groups (lane 2 vs. 1). (B) Densitometry after normalization with β-actin showed no significant change in the levels of NCOA4 in NaIO3-treated cells relative to controls. (C) Probing of lysates from a similar experimental set-up for LC3II showed increased expression in NaIO3-treated cells relative to controls (lanes 2, 4 vs. 1, 3). (D) Densitometry after normalization with β-actin showed a 2-fold increase in LC3II in NaIO3-treated cells relative to controls. Full blots and their details are provided in Supplementary Figure S1. Values are means ± SEM of the indicated n. * p ≤ 0.05. (E) Co-immunostaining of ARPE-19 cells with goat anti-ferritin and rabbit anti-LC3II followed by species-specific Alexa Fluor 488 (green)- and Alexa Fluor 546 (red)-conjugated secondary antibodies showed increased co-localization (white arrows) of the two proteins in NaIO3-treated cells relative to untreated controls (panel 6 vs. 3). Cells treated with only secondary antibodies showed no reaction (Supplementary Figure S2). Scale bar: 25 µm.

