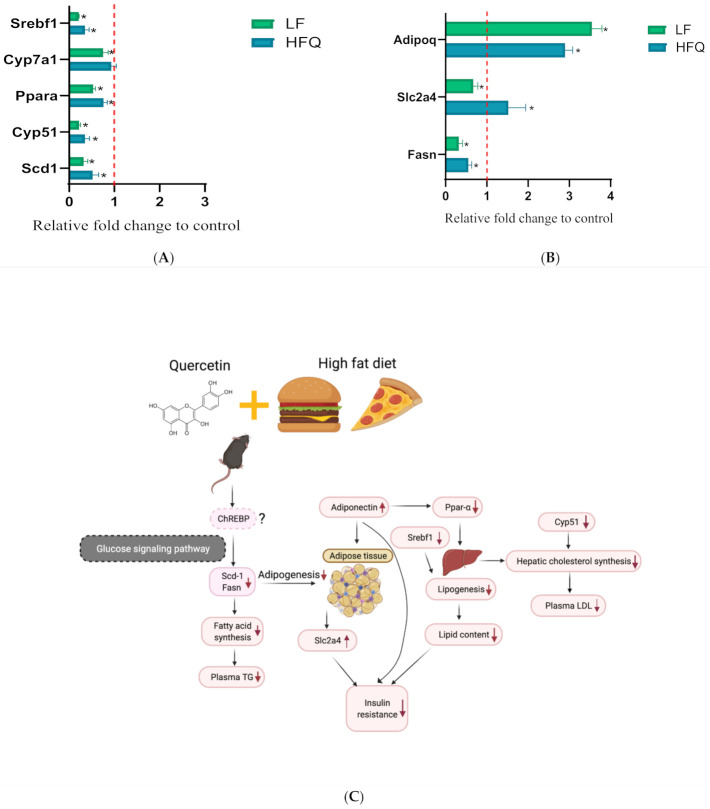
Figure 6.
(A) Relative hepatic gene expression of Srebf1, Cyp7a1, Ppara, Cyp51, and Scd1 in mice fed an HFQ diet compared to the HF diet (red dotted line), with the LF diet group shown as a reference. (B) Relative expression of Fasn, Slc2a4, and Adipoq genes in epididymal adipose tissue of mice fed an HFQ diet compared to the HF diet, with the LF diet group shown as a reference. Data are expressed as the mean ± SE, n = 4/group. Differences in mRNA expression for livers and adipose tissue were calculated after normalizing to 35B4 mRNA expression. An asterisk (*) indicates a significant difference (p < 0.05) compared to the HF diet. The dotted line (x = 1) represents the expression of control gene. (C) Proposed mechanism responsible for ameliorating insulin resistance in mice fed an HF diet supplemented with quercetin, involving the glucose signaling pathway, and ChREBP (dashes outline), as extrapolated from the literature [54].

