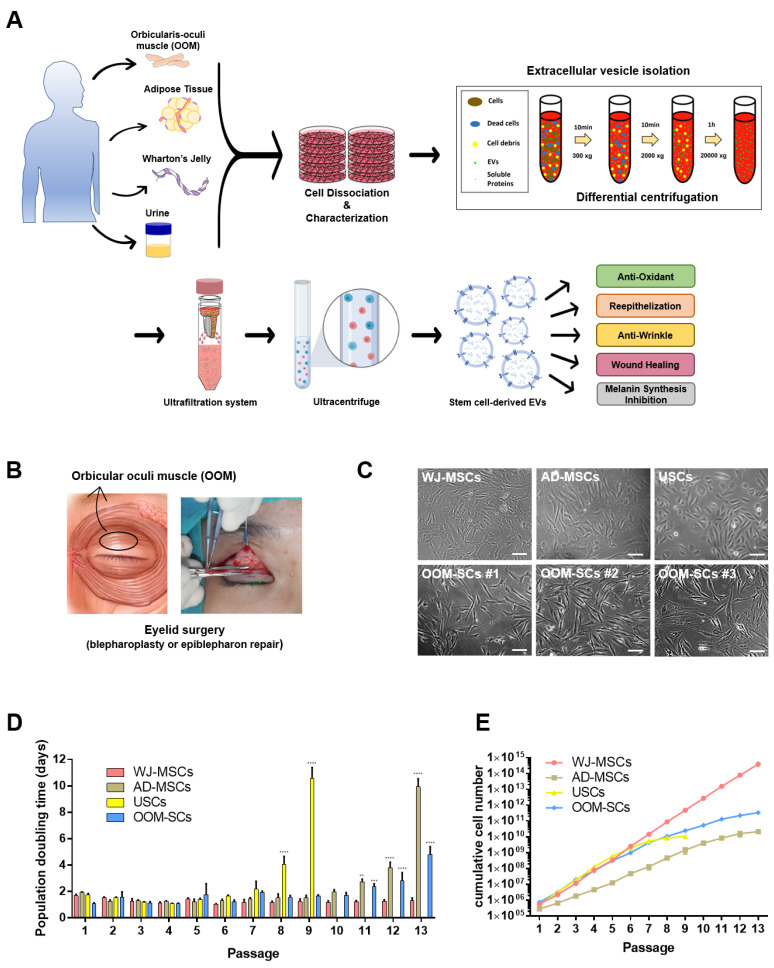
Figure 1.
Schematic representation for application of novel OOM-SC-EVs and OOM-SCs preparation. (A) Schematic representation of isolation of stem cells from various sources, such as OOM, adipose tissue, Wharton’s Jelly, and urine and then their characterization, which were carried out via the enzymatic digestion using collagenase type II. USCs were obtained via centrifugation at 400× g, and purification of EVs from OOM-SCs and WJ-MSCs using differential centrifugation, ultrafiltration, and ultracentrifugation. Our study sought the therapeutic applications of the purified EVs including antioxidant, anti-senescence, whitening, and wound healing. OOM-SC-EVs were isolated from the collected culture soup of the OOM-SCs cultured in α-MEM medium containing exosome-depleted 10% FBS for two days, which were subjected to differential centrifugation, vacuum filtration, ultrafiltration, and ultracentrifugation for EVs purification. The antioxidant, anti-wrinkling, skin whitening, and in vitro and in vivo wound healing activities of the OOM-SC-EVs were observed. These vesicles can be further applied for therapeutic applications in combination with microneedles. Parts of the schematic diagram are created with BioRender.com. (B) Figure illustrating the upper eyelid blepharoplasty for the isolation of pretarsal OOM after the consent of donors. OOM-SCs were prepared from healthy donors. (C) Morphologies of WJ-MSCs, AD-MSCs, USCs, and OOM-SCs (isolated from different donors (OOM-SCs #1(5y), OOM-SCs#2 (19y), and OOM-SCs#3 (67y)). Phase-contrast microscopic image of isolated cells that showing spindle-like morphologies. Scale bar = 50 μm. OOM-SC proliferation kinetics including (D) population doubling time and (E) Cumulative cell number of WJ-MSCs, AD-MSCs, USCs, and OOM-SCs. Cell population doubling time was measured up to passage 13. For cumulative cell number, cells were counted using a hemocytometer after staining with 0.4% trypan blue under a phase contrast microscope. Figure 1D data are presented as mean ± SD. All experiments were performed for three independent times, and statistical significance was determined using RMANOVA: ** p < 0.01, *** p < 0.001, and **** p < 0.0001.

